The Bottom Is In - Bitcoin Update
BTC trying to make a break higher, technical patterns and important levels to watch.

Bitcoin & Markets | July 9, 2026
Independent bitcoin analyst 12+ years, exploring bitcoin and monetary evolution. Subscribe today!
Hello bitcoin warriors,
The last update, I said, "Something's changed." After another week and a 5% gain, I still have that recovery feeling.
This is a fantastic time to increase your DCA. The downside appears limited, while bitcoin is capable of those explosive 10% up days. That's something people often forget during a bear market, when we're conditioned by 5%, 7%, and even 10% down days. In a bull market, those same moves happen in reverse.
Today, I'll walk through a few of my own charts before commenting on a couple of the best charts I've seen on X this week.
Quick Content Update:
I haven't been writing much about bitcoin over the last month that will likely start to increase when the bull market gets kicking again. Please stay subscribed! I appreciate everyone who has stuck it out during the bear market.
My content on Rogue Macro has taken priority, due to the potential market size to support paid macro analysis. I do cover bitcoin there, as well. A Pro tier membership gets you access to both because I double post the Pro tier content here, as well.
Make sure you are following both my accounts on X, @AnselLindner and @RogueMacro_.
Steady As She Goes
Let's revisit the projected path from the last update. I expected the top of the falling wedge to provide resistance for a few days, along with the 20-day moving average (not shown).
Instead, price sliced right through the wedge boundary and closed above the $63k level I was watching. That long wick on July 6, which reversed sharply to close positive on the day, was a strong sign that buyers are stepping in. It's completely natural to see price come back and test the top of the pattern, just as it has.
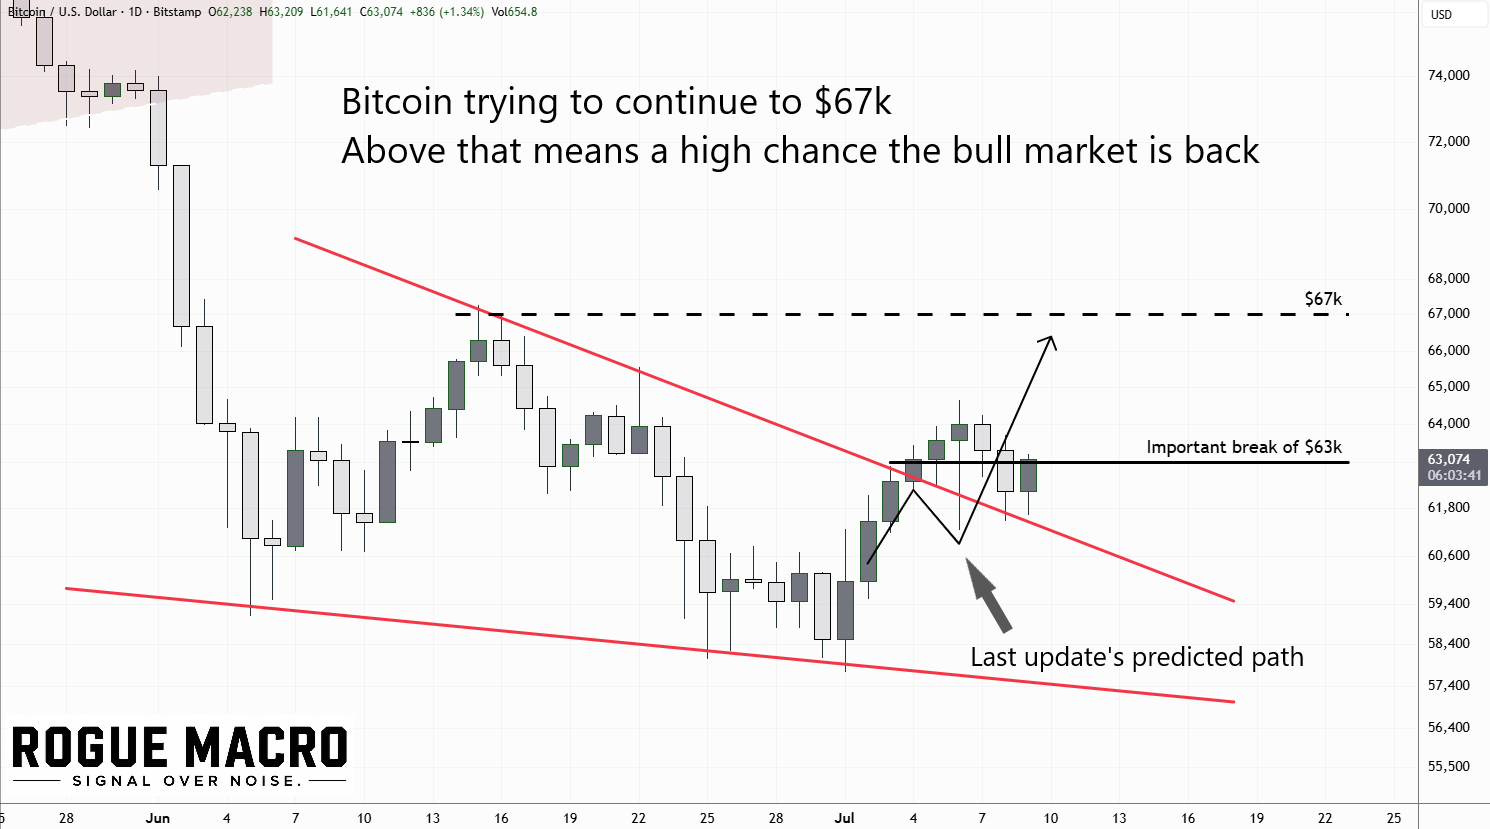
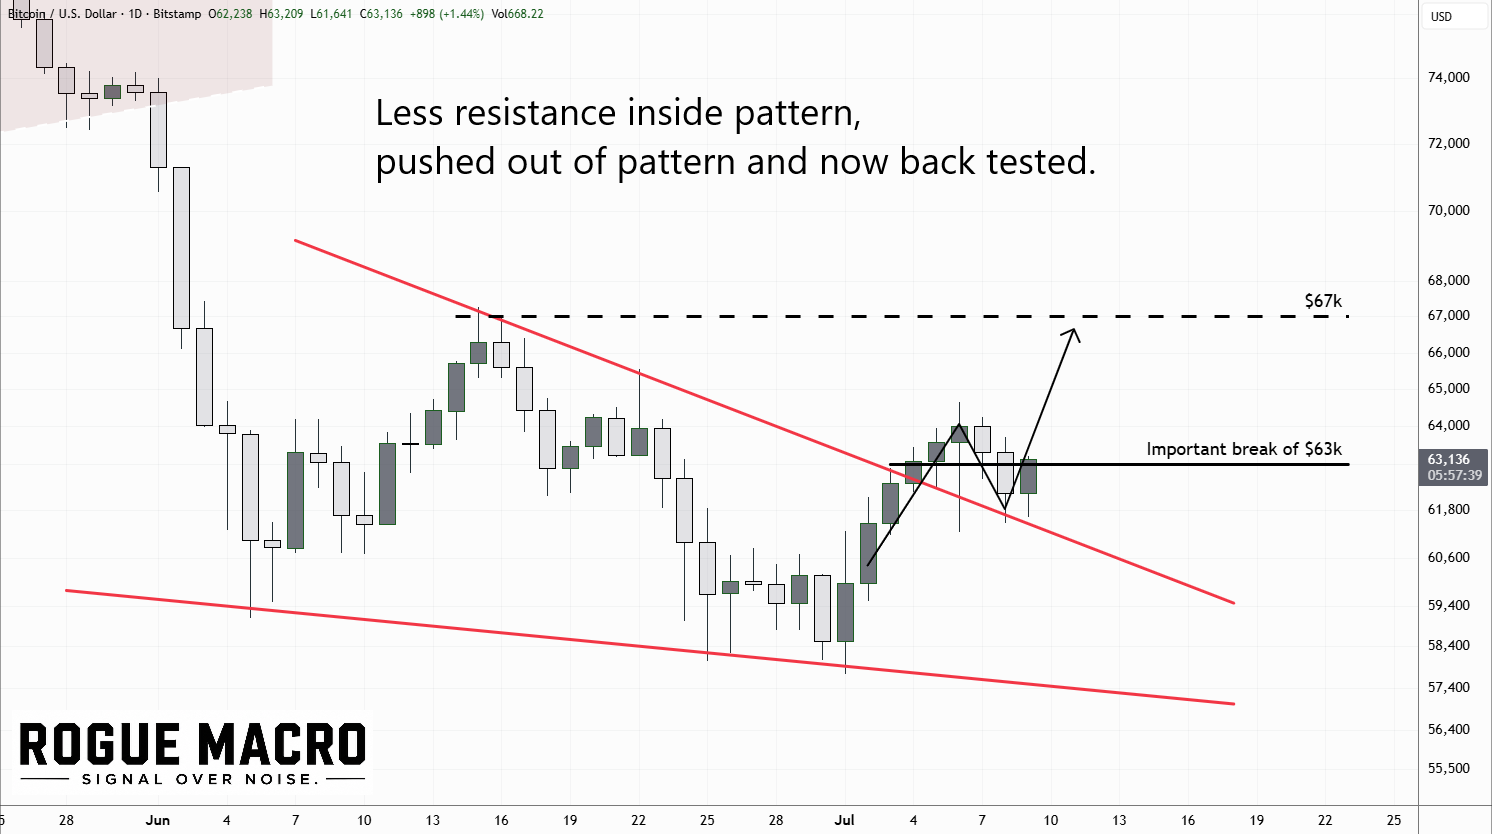
Currently, price is battling around $63k once again. I'm getting excited about a move toward $67k, although that doesn't get us out of the woods just yet.
I've updated the projected path below to reflect a breakout followed by a backtest, but my $67k target remains unchanged. I think there's a high probability bitcoin reaches that level before the next update.
Our next chart is a bit busy, but I wanted to highlight a few possibilities. First, it's possible the falling wedge was simply the first leg of another bear flag. I copied the slope of the previous two bear flags and projected a "what if" extension onto the current price action.
In that scenario, price could push above the 50-day moving average before stalling near the top of the new channel, just as it did during the previous two rallies. That would imply a move toward $70k followed by a pullback to around $60k.
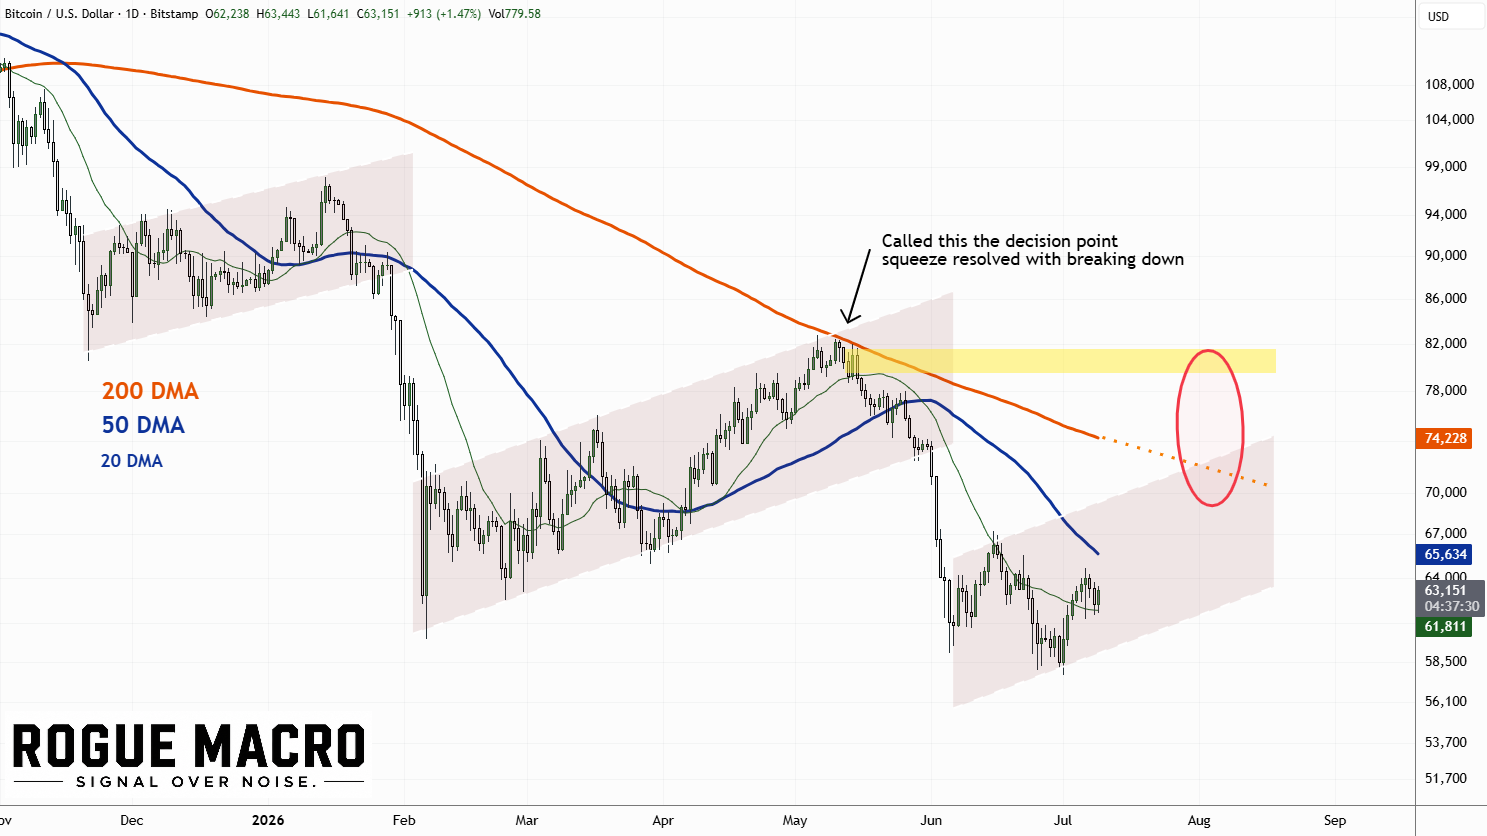
The yellow shaded area marks the horizontal range from the important squeeze I discussed extensively at the time. It also includes the $80k level. The red oval highlights my next major area of interest: the confluence of the channel top, the 200-day moving average, and that horizontal resistance.
If bitcoin can break through the yellow zone, I think a retest of the all-time high becomes the most likely outcome. If it fails at the 200-day moving average again, there may be one final leg lower in this bear market. At the moment, though, I think that remains the lower-probability scenario.
Other Charts
I saw some different versions of this chart floating around X this week. I didn't make it. The 4-year cycle is so damn convincing isn't it?
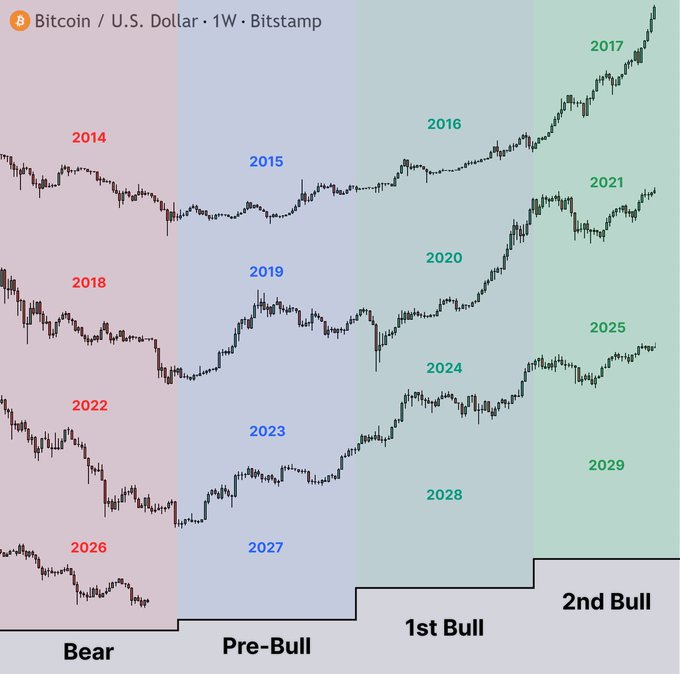
According to this version, we're probably a little early to declare the bear market officially over. If it takes another month or two to reclaim $80k, that would fit the historical pattern quite well. Don't expect bitcoin to rocket back to $100k overnight. Recoveries take time.
Remember, the 2025 bull market peak was relatively muted. It's reasonable to expect a similarly muted, and perhaps slightly earlier, bear market bottom.
That said, I'm increasingly convinced the classic four-year cycle is dead. The forces that historically drove it, like the halving and the business cycle, are no longer aligned. As the halving's supply shock becomes less significant over time, I expect the business cycle to become the dominant driver. Right now, the business cycle is expanding.
Below is a another great chart from Checkonchain, the Mean Reversion Index. He discussed it in an explainer video with Bhatia 3 months ago. It's a really good video, make sure to check it out. The indicator combines 9+ different type of mean-related indicators, all of them listed at the top, so you can take a look.
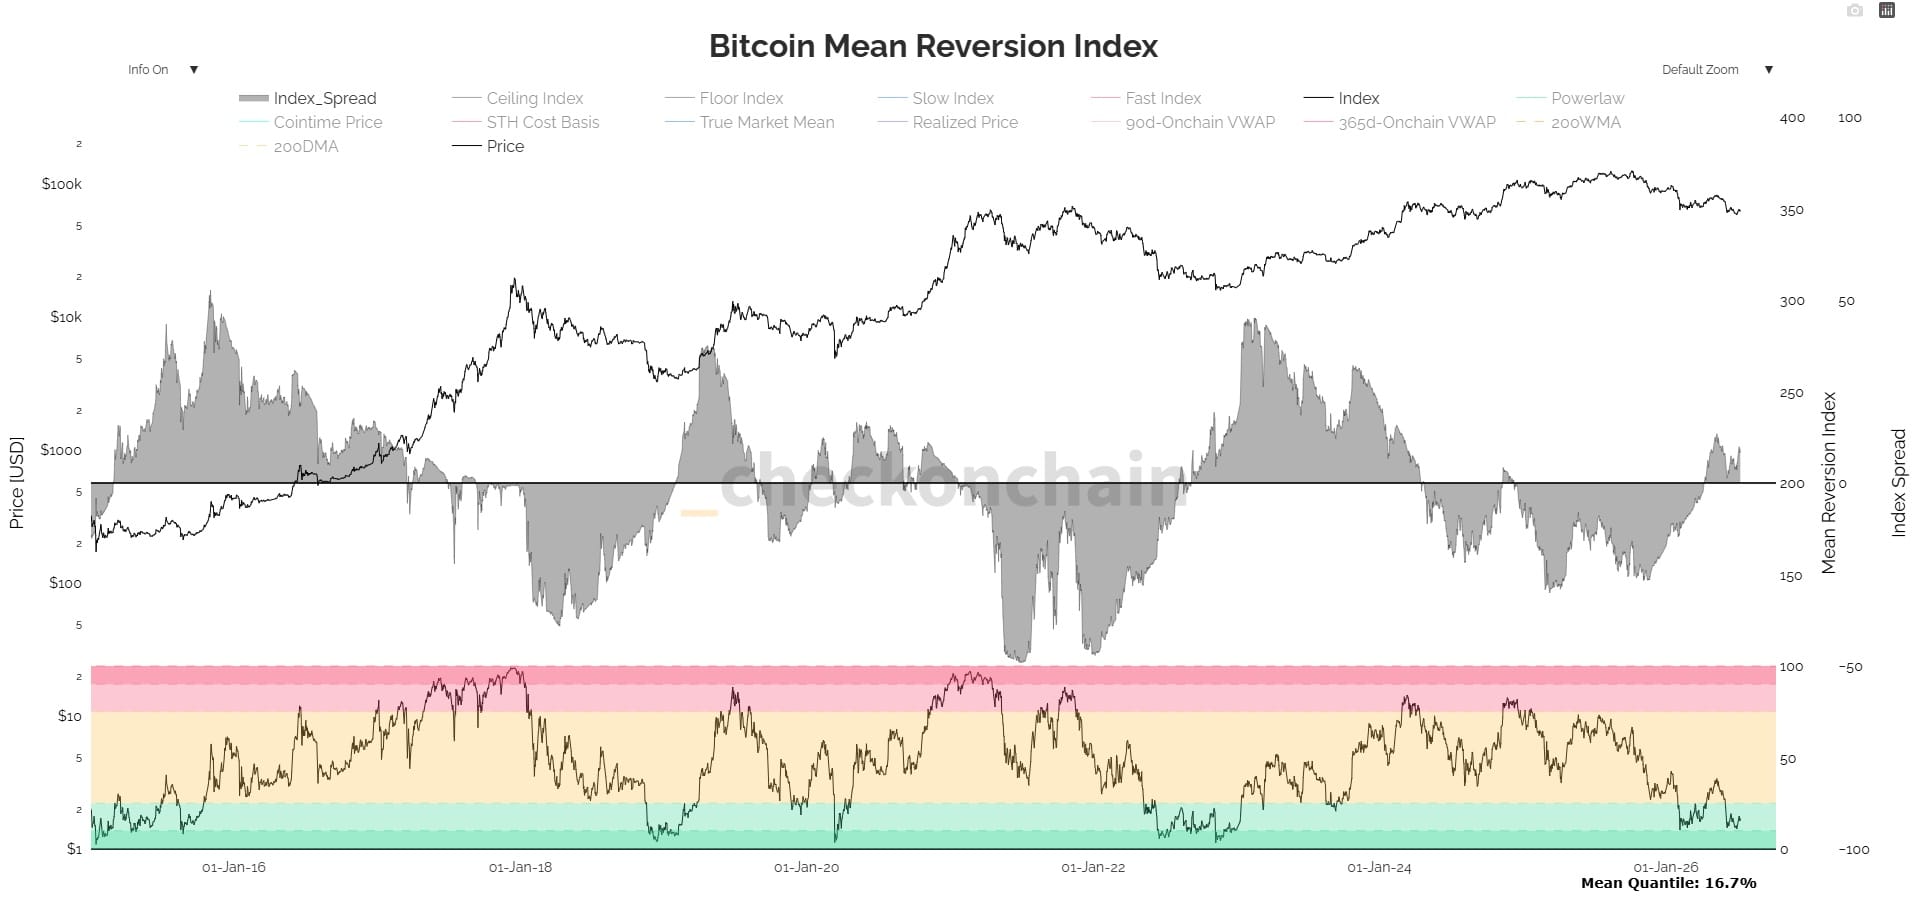
On the far right, you can see the gray region has turned positive, a condition that has historically occurred as bitcoin emerges from bear markets.
In that interview, Checkmatey said he believed the bottom was already in. That turned out to be slightly early, as price eventually made one more lower low, but not by much. If you bought around $60k three months ago, you're still doing just fine.
One interesting observation is that, aside from the COVID crash, previous bear market bottoms weren't sharp V-shaped reversals. They were prolonged bottoming processes. Had the low occurred three months ago, this cycle would have been unusually brief. Instead, revisiting the lows has made this bottom look much more consistent with previous cycles.
Also notice that the 2024–2025 bull market never reached the dark red zone. In that same interview, Checkmatey argued this reflected the lack of retail FOMO during the cycle. Fewer speculative retail buyers means fewer weak hands to flush out during the bear market. That explanation makes sense to me, especially given how much bitcoin has migrated into stronger hands like the ETFs and MSTR.
Conclusion
I'll repeat what Checkmatey said a few months ago: I think the bottom is in. I'm increasingly bullish that bitcoin will continue reverting toward its long-term mean and begin the next bull market.
Things I'm watching:
- $67,000 level
- Potentially forming another channel, top around $70,000 for the next move.
- 200 DMA and the horizontal area around $80,000. If bitcoin clears that zone, the bull market is underway, and $100,000 should happen fast.
- Movement of the Clarity Act in the US Senate. Price will tell us how likely it is to pass. If we start heading into the higher levels mentioned above, Clarity is more likely to pass.
On the next update, I'll be looking at MSTR and STRC. Make sure you're subscribed!
HODL strong. Thanks for reading! PLEASE SHARE!
A
- Podcast links and Socials
- Disclaimer
- Feedback form
- Original charts and analysis are CC-BY