Did The Bitcoin Power Law Quietly Change?
The exponent keeps falling, the intercept keeps rising, and the fair value keeps moving. Here's what I found.
Bitcoin & Markets | June 4, 2026
Exploring the intersection of bitcoin, macroeconomics, markets, biology, and politics within the evolving global order.
I'm not a strict adherent to the Bitcoin Power Law. Before it, I was fascinated by the Bitcoin Stock-to-Flow model. I view both as interesting attempts to quantify a genuine directional force in bitcoin, but I don't believe either model is ultimately "right."
The monetary argument for a consistently rising bitcoin price is straightforward. Bitcoin's supply is capped and growing slowly toward a known maximum of just under 21 million coins. Demand, meanwhile, is inferred from network effects, adoption, and bitcoin's increasing integration into the global financial system.
As Bitcoin becomes more widely known and more deeply embedded in cash balances, corporate treasuries, and sovereign reserves, demand should continue to grow on average while supply remains largely fixed.
The Bitcoin Power Law and Stock-to-Flow (S2F) models attempt to mathematize this general inference.
S2F famous failed several years ago, and has since undergone several adjustments. I think this effort is still valuable, perhaps in the future leading to more fundamental discoveries about the nature of bitcoin and economics.
It took several more years, but the Bitcoin Power Law is starting to face similar scrutiny.
As I looked into the model, it became apparent that it has also been adjusted over time. These adjustments are often explained away because the model is a purely mathematical relationship derived from historical price data. As prices change, the constants in the formula change as well. But that immediate should bring into question the predictive power of the model.
Giovanni's Power Law
Giovanni Santostasi has stated he began working on Bitcoin power-law relationships around 2014, with 2015 often cited as the first public appearance of the idea. Giovanni has credited Trololol's Rainbow Chart inspiration which was widely discussed at that time. But he published his first chart of the Power Law in 2018.
With the recent dip in bitcoin's price, discussion of the Power Law has come back up in online conversation. The website BitcoinPower.Law is showing a Fair Price of $138,500.
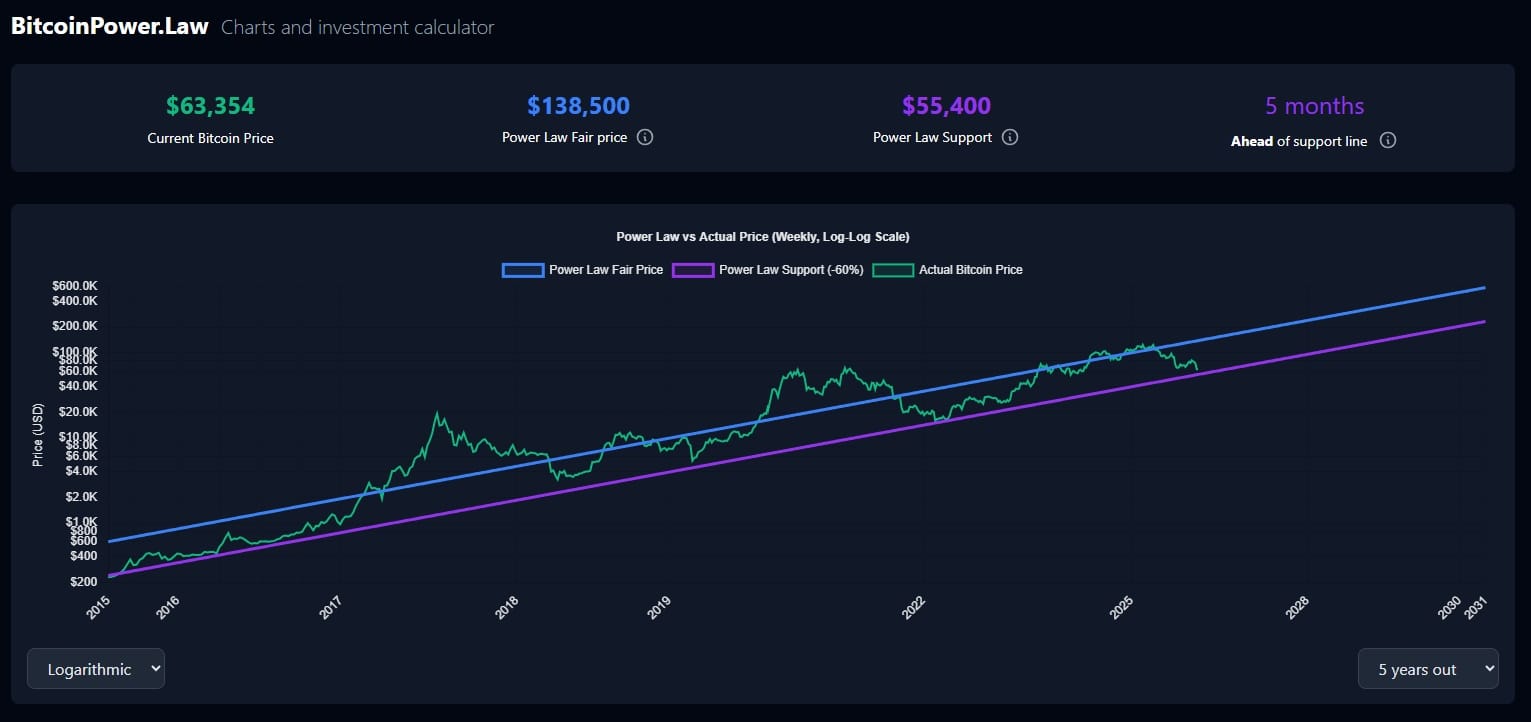
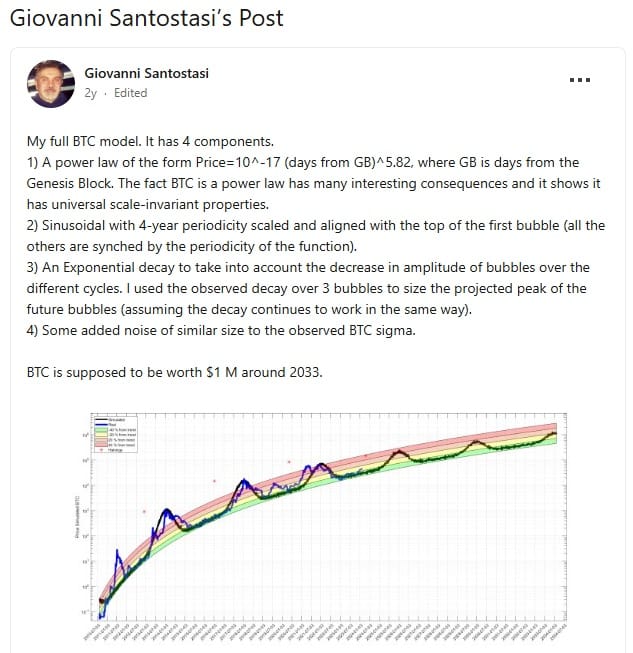
My first thought when seeing this chart again is that the price has been below the Fair Price for an extended period, essentially since May 2022. The sinusoidal pattern originally highlighted by Giovanni, where price oscillated above and below Fair Value, is no longer obvious. That observation made me think: has the formula been updated?
Original Giovanni Post
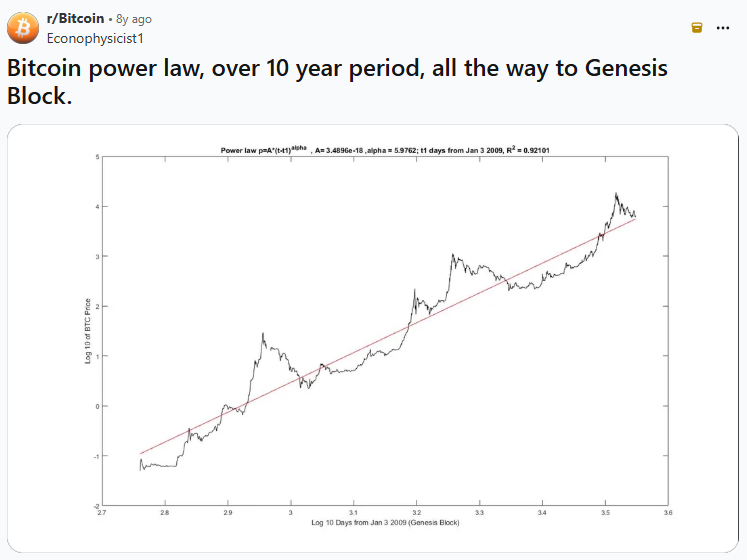
As you can see on this first-ever chart of the Power Law, it clearly states the two variables we need, A= 3.4896×10^−18; and n= 5.9762
These are not the current numbers used by BitcoinPower.Law.
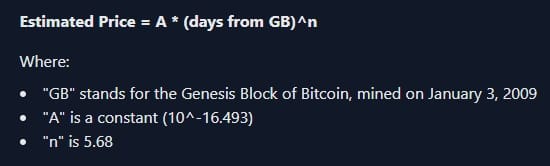
Using Giovanni's original formula, I calculate a Fair Value today of approximately $187,655. That's substantially higher than the current estimate of $138k.
Other Exponents and Constants Used
This discovery made me wonder how many times the exponent and constant has changed throughout the years to project Fair Value into the future. The answer appears to be: quite a few.
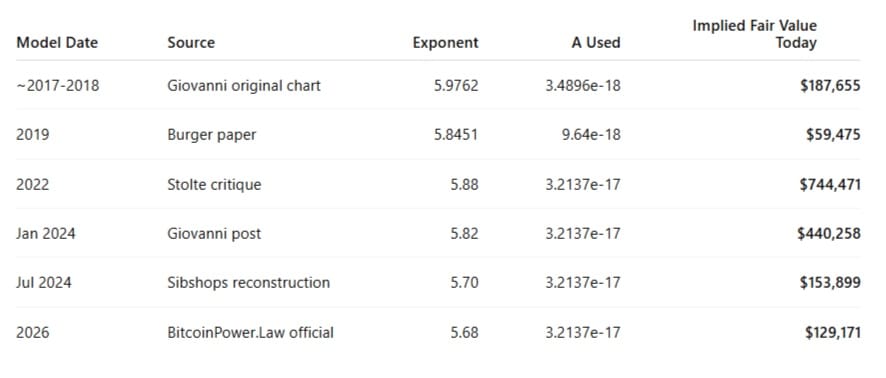
The next major version I found came from Harold Burger's paper written in 2019. In that paper, he used an exponent = 5.84509376; and A ≈ 9.64×10⁻¹⁸.
In 2022, Tim Stolte published a Medium artice attempting to debunk the Power Law. Regardless of whether one agrees with his conclusions, it is one of the best examinations of the model's underlying mathematical assumptions. Stolte derived an exponent of approximately: n = 5.88 (no mention of constant A).
In a 2024 LinkedIn post Giovanni cited an exponent of: n = 5.82. The exponent appears to be drifting lower over time.
Later in 2024, Reddit and Mastodon user Sibshops created a great chart published an excellent chart illustrating just how dramatically different exponent values can affect the model's future Fair Value projections.
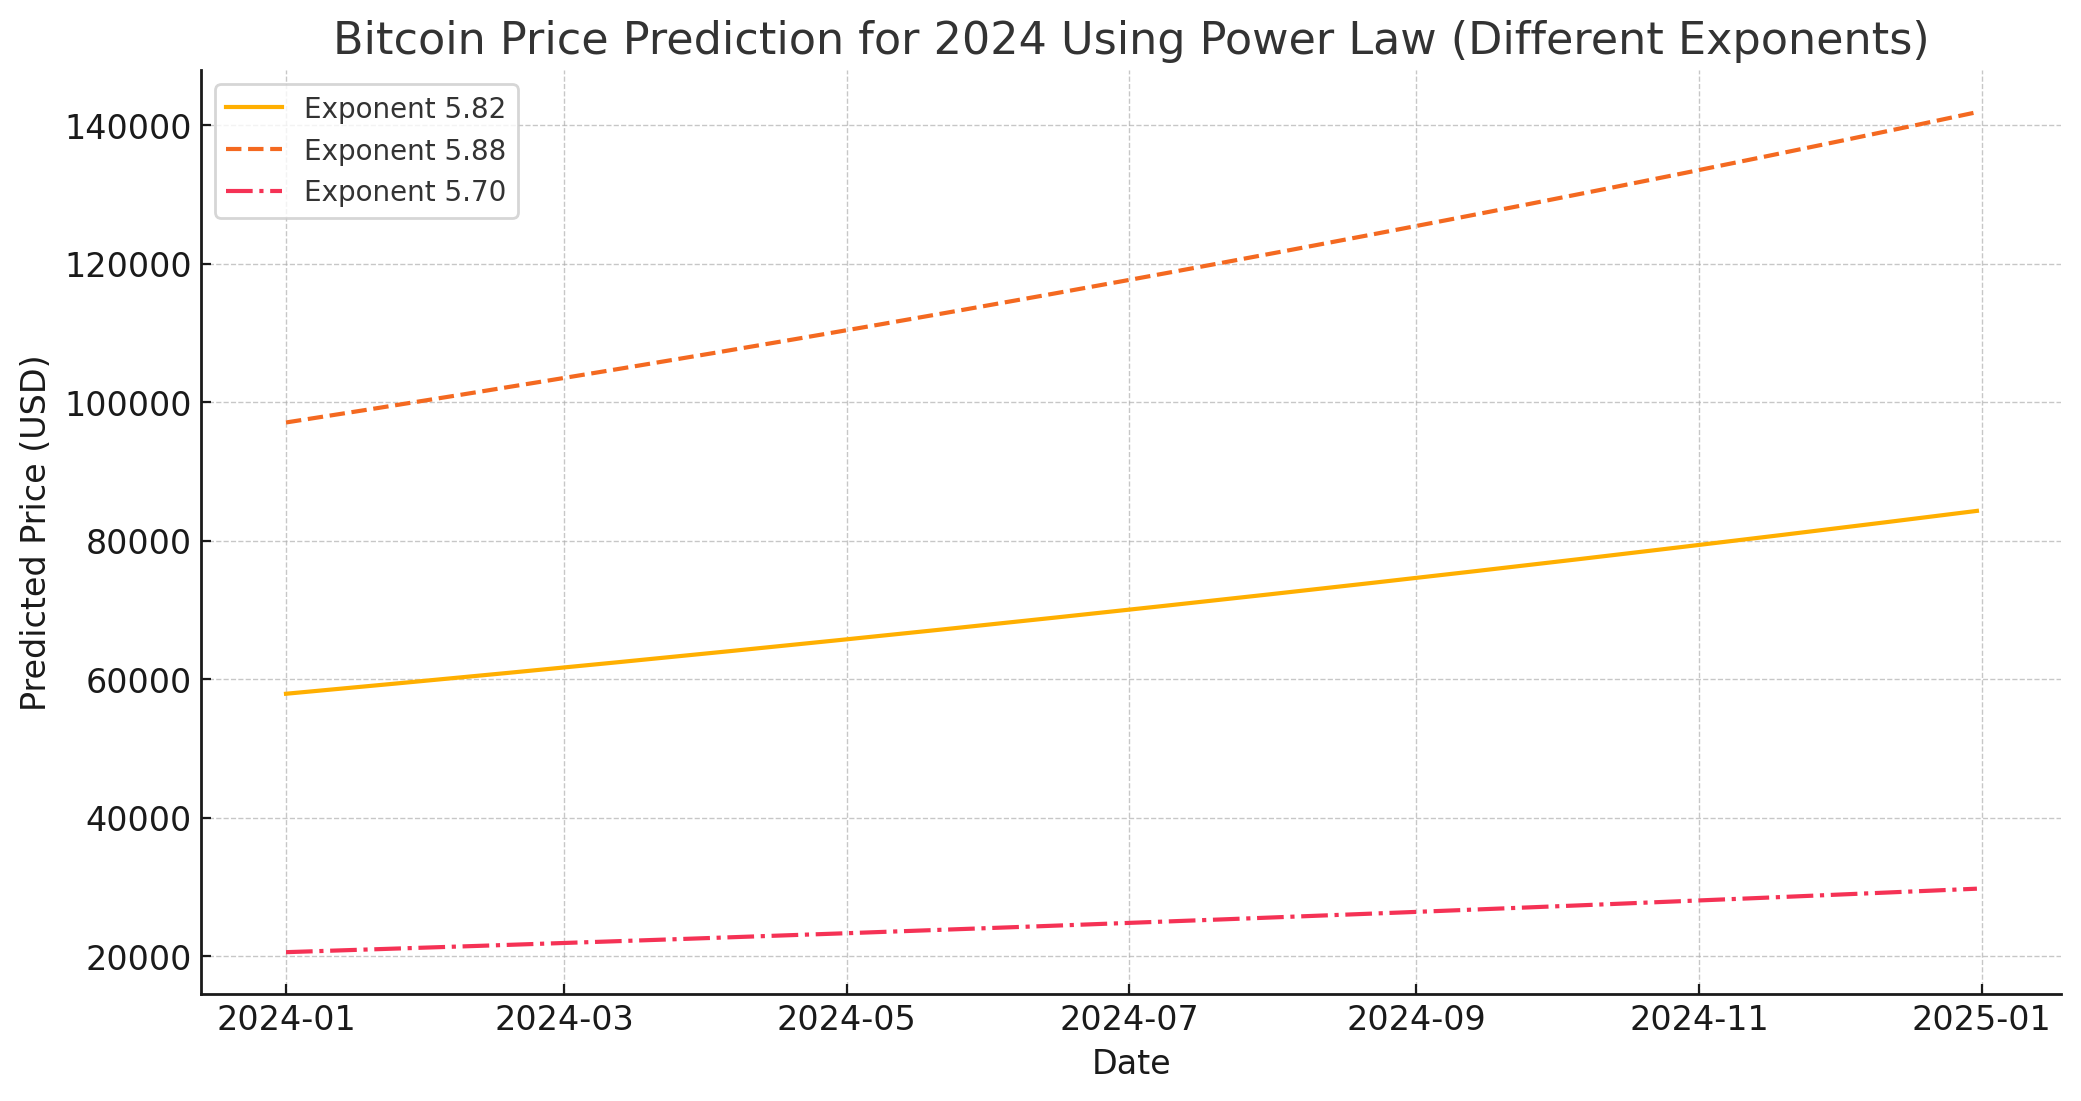
None of these previous post show an n value of 5.68, which it is now. What conclusions can we draw.
Conclusion
In researching these changes, I realized that this is exactly what we'd expect if the number were recalibrated every year or so. The A constant and exponent are derived from historical price data. As new data arrives, the regression is re-fit and the values naturally change. This is not evidence of manipulation or anything nefarious. It is simply how the mathematics works.
What caught my attention, however, is the direction of those changes. Over time, the exponent has consistently drifted lower while the intercept has drifted higher. The result is an ever-flattening curve Power Law.
There is no notable difference with a consistently flattening of the Power Law and just a slowing in growth as adoption become deeper. Indeed, predictions would be improved by assuming the Power Law will overestimate future prices by a significant amount of a 4-5 year period.
The Power Law still maintains an impressive fit to Bitcoin's historical price action. But historical fit and predictive power are not the same thing. If the exponent eventually stabilizes and remains relatively constant for many years, the case for the Power Law will become stronger.
HODL strong. Thanks for reading! PLEASE SHARE!
A
- Podcast links and Socials
- Disclaimer
- Feedback form
- Original charts and analysis are CC-BY