Is Bitcoin Dead? Chart Update
A falling wedge, historic RSI divergence, and why I think the worst may be behind us.

Bitcoin & Markets | July 1, 2026
Exploring the intersection of bitcoin, macroeconomics, markets, biology, and politics within the evolving global order.
Hello warriors,
If you're still here, I salute you! We're living through the most depressing bear markets in bitcoin history. But we're still here. These are the hard times that pay off with gains in the future. It's not easy holding bitcoin.
Bitcoin still has massive upside, view it as a fantastic opportunity to grab bitcoin or MSTR before the bull market returns. Gold's market cap hit a high of $38 trillion recently. Bitcoin is a better asset in almost every way and is sitting at only a $1.2 trillion market cap. The next bull market could easily bring bitcoin to $10 trillion, and add a zero to the current price.
Content Update:
I haven't been writing much about bitcoin over the last month for a couple reasons. First, my kids are off for the summer and I have more responsibilities there. Second, the bear market has taken a toll on audience size. Third, there is simply much less news happening in bitcoin these days.
My content on Rogue Macro is taking priority, and I cover a little bitcoin there as well. Make sure you are following both my accounts on X, @AnselLindner and @RogueMacro_.
Something's Changed
Since the ATH last October, we've been in two significant bear flags. One came back to the 100 DMA before continuing down, and the other made it up to the 200 DMA before it failed as well.
Back in May, when price was being squeezed by the top of the flag, the 200 DMA, and the 20 DMA, I said it was a decision point. If price broke out of that squeeze to the upside, we were heading back into a bull market. However, if price dropped down, I said we were looking at a month or more just trying to get back to that point.
I didn't foresee going to $58k, but the timing was the important part to me. I'm not selling, so depth is less important than timing IMO.
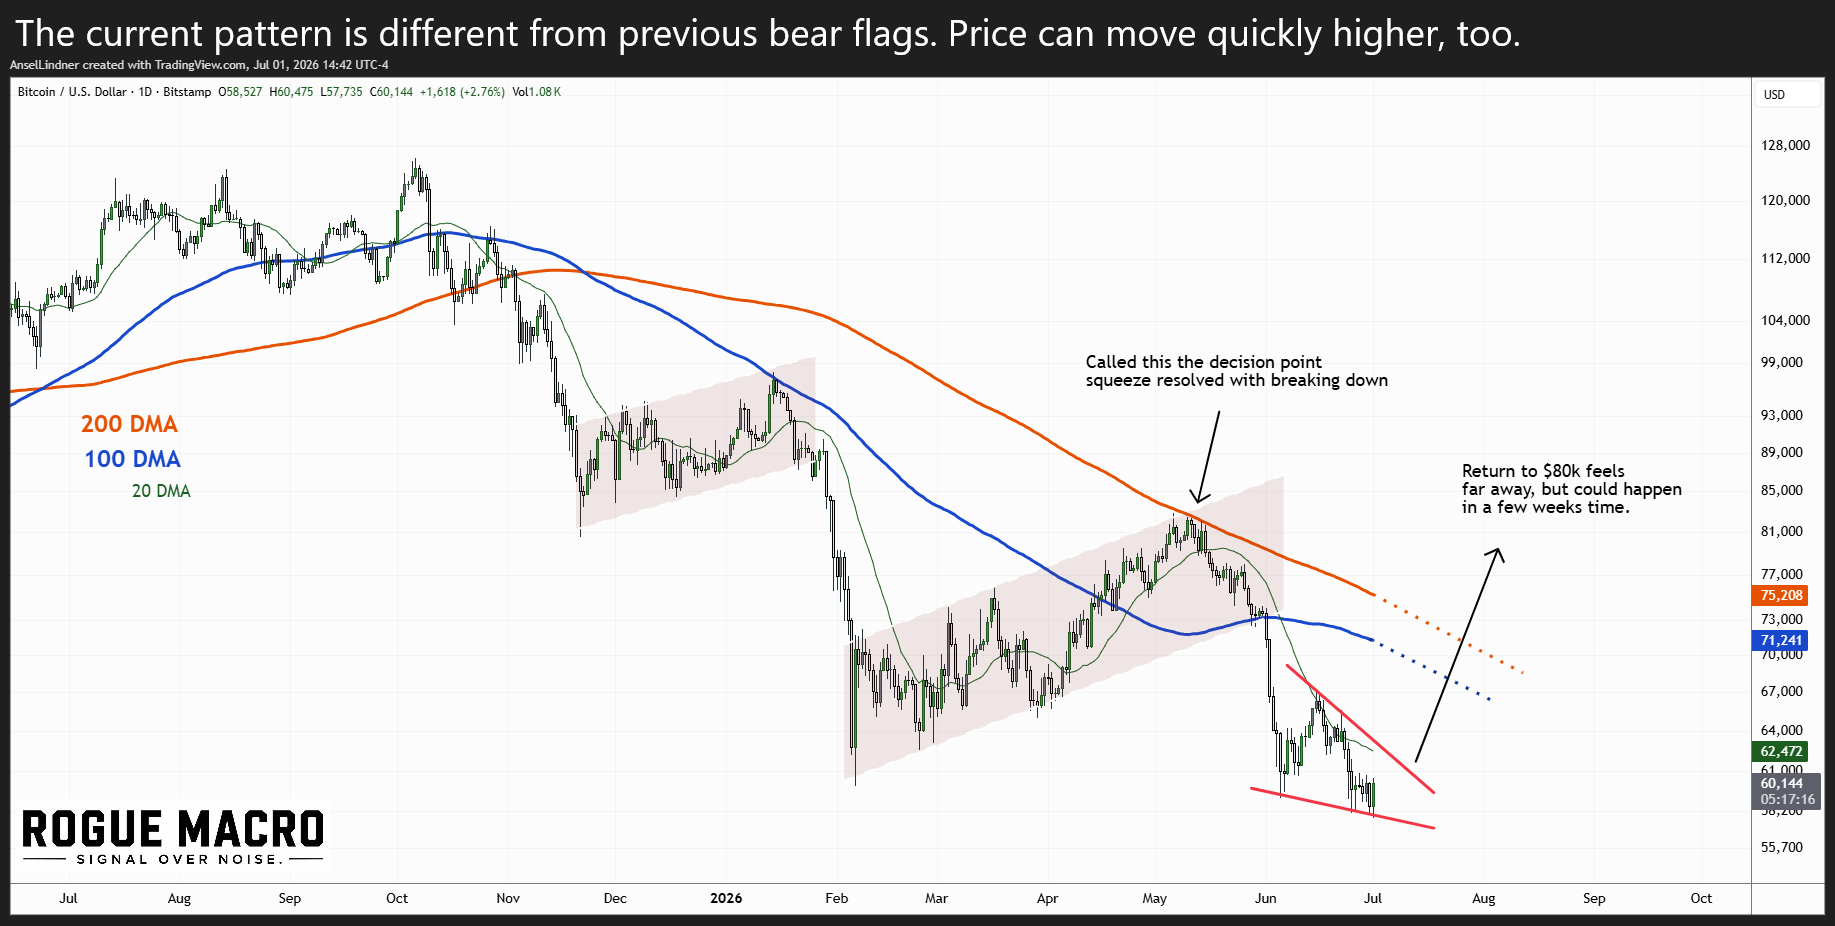
During the dark days of the bear market, when the dominant price movement has been large dips of 5-10% in a day, we forget that bitcoin can easily rally 5-10% in a day as well. It can make up a lot of ground when the bull market returns. July could end up 20% very easily. $60k x 1.2 = $72k.
Unlike the previous two bear flags, the current consolidation is taking the shape of a falling wedge. As a pattern it's generally considered much more constructive from a technical perspective.
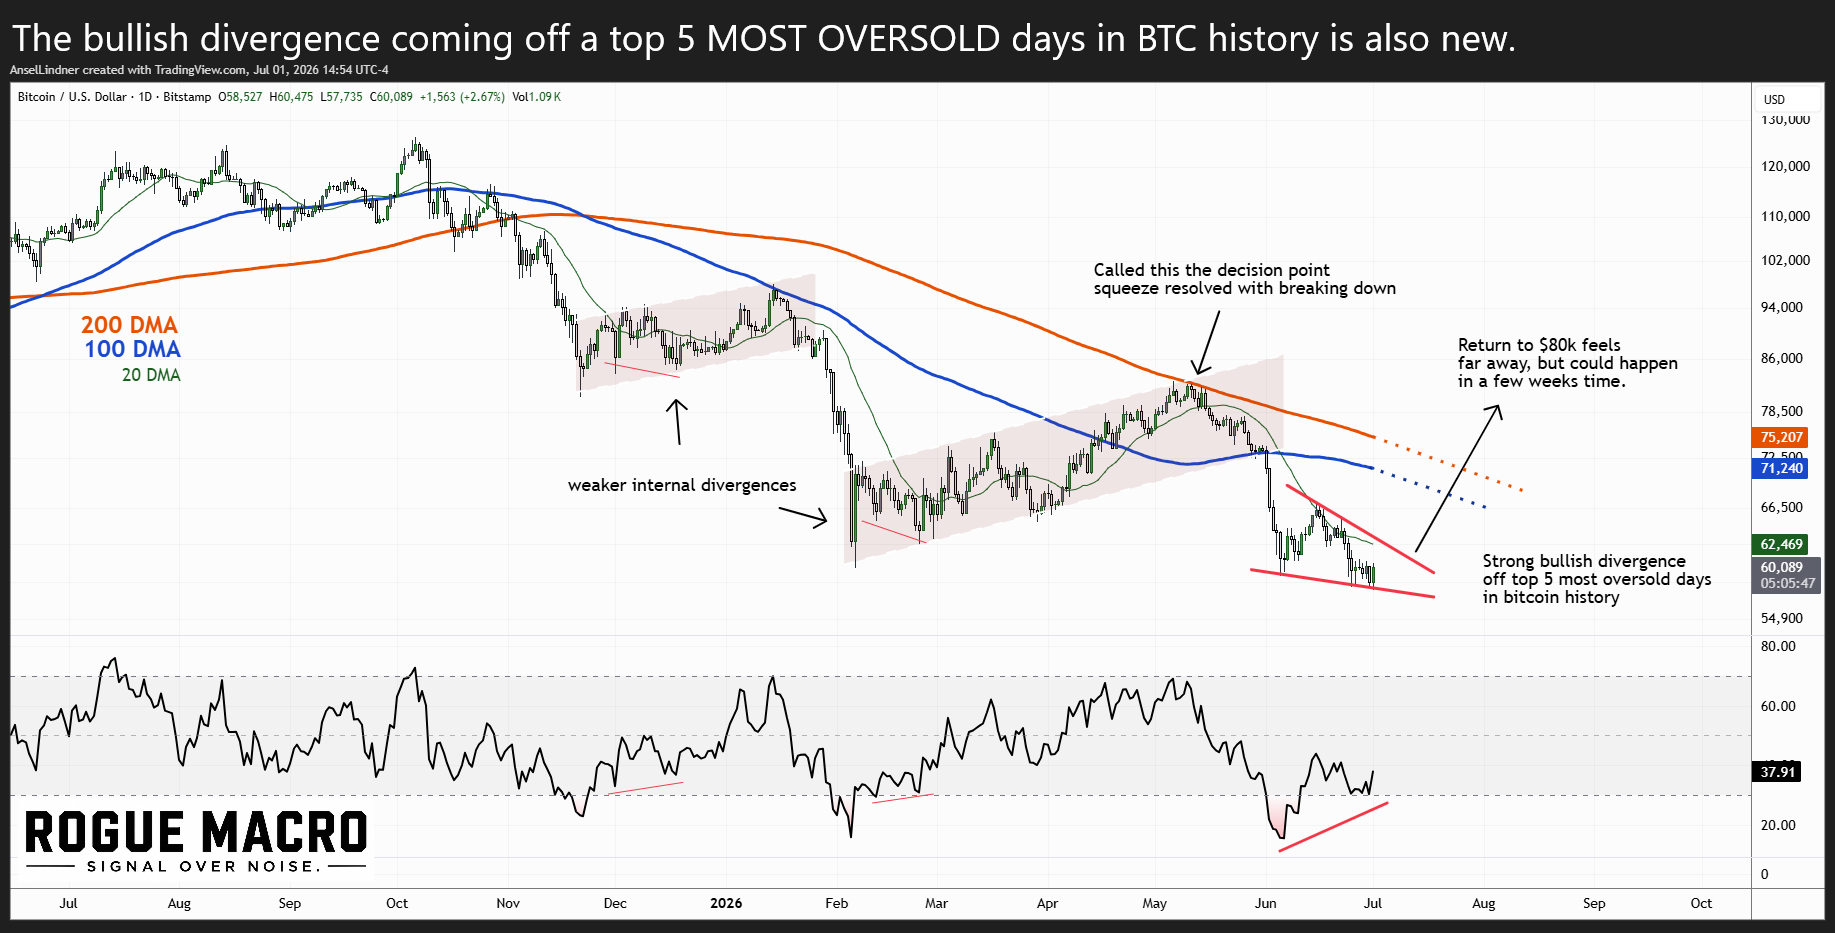
A falling wedge after a severe decline means selling pressure is steadily losing momentum, with each successive push lower becoming less effective. When it coincides with deeply oversold RSI and bullish divergence, it indicates that patient buyers are absorbing supply as sellers become exhausted. A confirmed breakout would be a move above the pattern's upper trendline on increased volume. I'll update you on X in the coming days about this. Make sure you're following me.
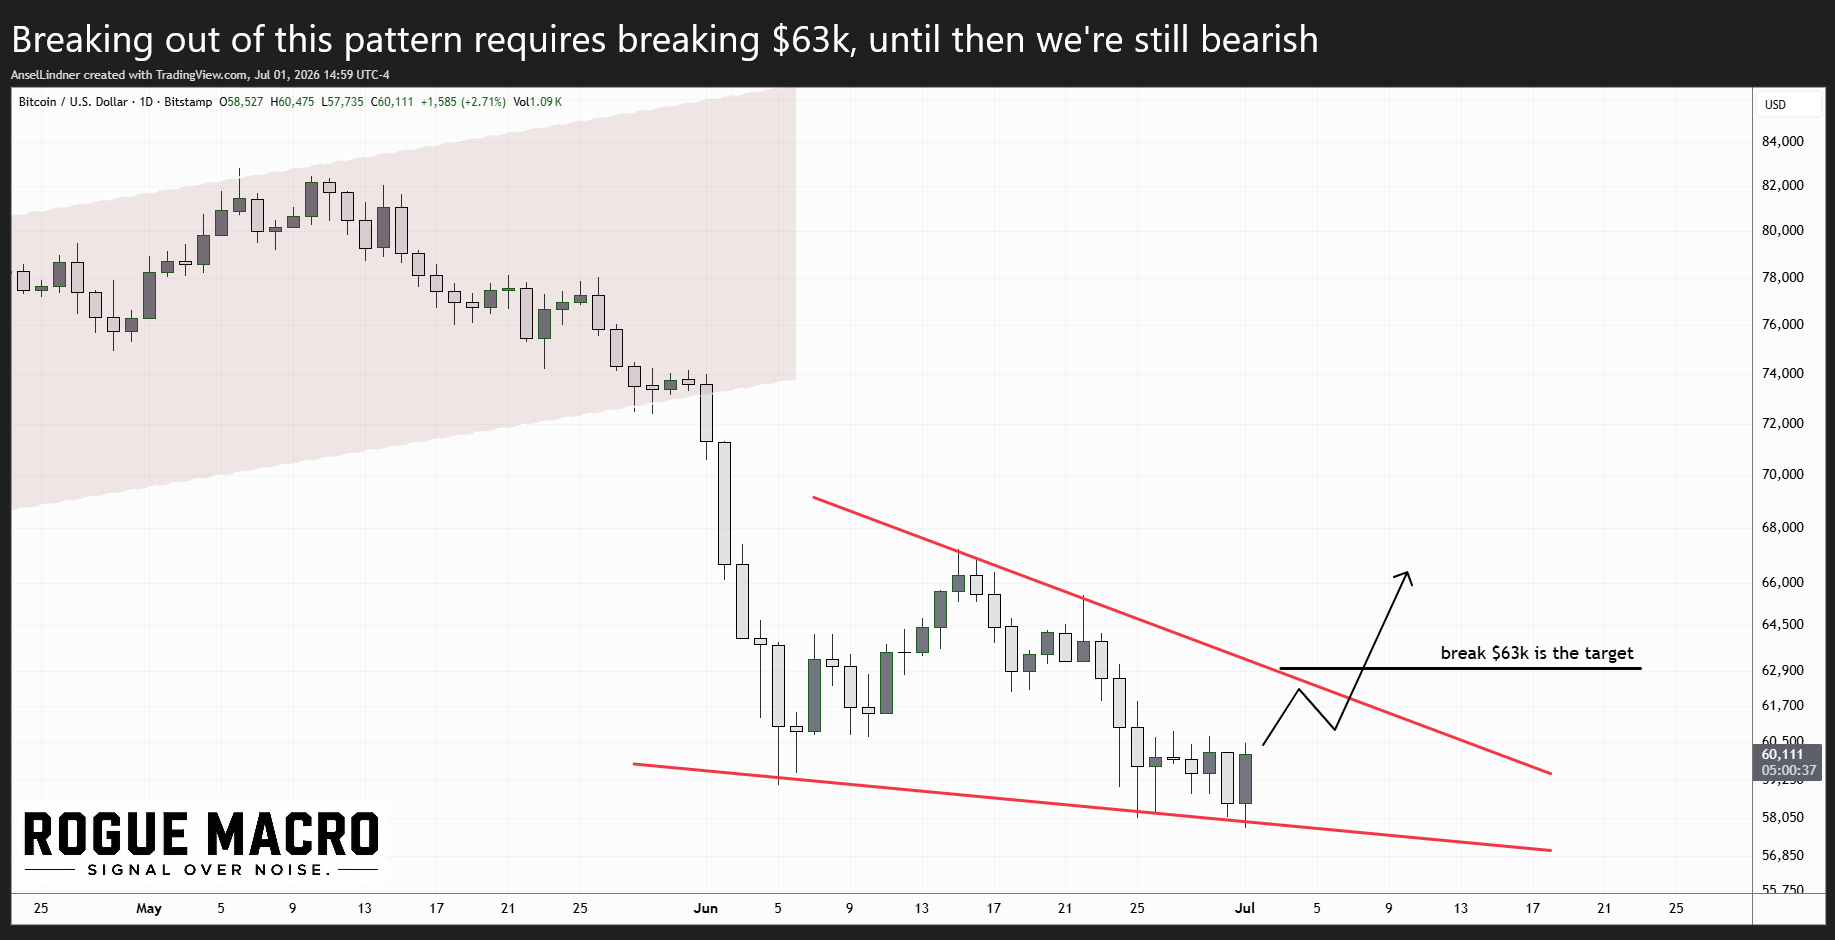
Zooming in a little on the daily chart, we see the falling wedge and I highlighted $63k as the breakout trigger. If price climbs above that, the odds of a sustained recovery increase substantially. Until then, further downside is possible.
Conclusion
The coming days and weeks should tell us a lot. If the falling wedge confirms with a breakout above resistance, the odds favor the bear market finally giving way to a new recovery. Until then, stay patient, stay disciplined, and remember that the best long-term opportunities in bitcoin have almost always come when sentiment was at its worst.
HODL strong. Thanks for reading! PLEASE SHARE!
A
- Podcast links and Socials
- Disclaimer
- Feedback form
- Original charts and analysis are CC-BY