Simple Support and Resistance - Bitcoin Update
In this post, we look at the progress of the bitcoin price over the last couple of weeks, and discuss a few insights you won't get elsewhere. Then I look at a long-term indicator with surprising accuracy.

Bitcoin & Markets | May 21, 2026
Exploring the intersection of bitcoin, macroeconomics, markets, biology, and politics within the evolving global order.
Bitcoin Charts
Last week:
The way we resolve this pinch between the 200- and 20-day MA's is going to dictate what happens over the next several weeks.
Breakdown? No breakout until at least next month. We struggle for support on the 50-day around $75k, try to get feet under the price for another run at the 200-day. By then, it will be far below $80k.a
Break upward? Price should very quickly hit $85k and push higher into a real move.
So far, we've followed the breakdown scenario from last week. Price dipped Friday and through the weekend. Eventually finding support right around the 50-day. The fact that it didn't quite get to the 50-day tells me there's a little bit of strength in the bulls still.
Hypothetically, if I'm bullish and want to make sure my order gets filled around the 50-day, I'll place it slightly above. As price is coming down into the bid area, sells will match with bids. If there are more bids than asks price won't be able to get all the way to the level of interest, in this case the 50-day. That's bullish.
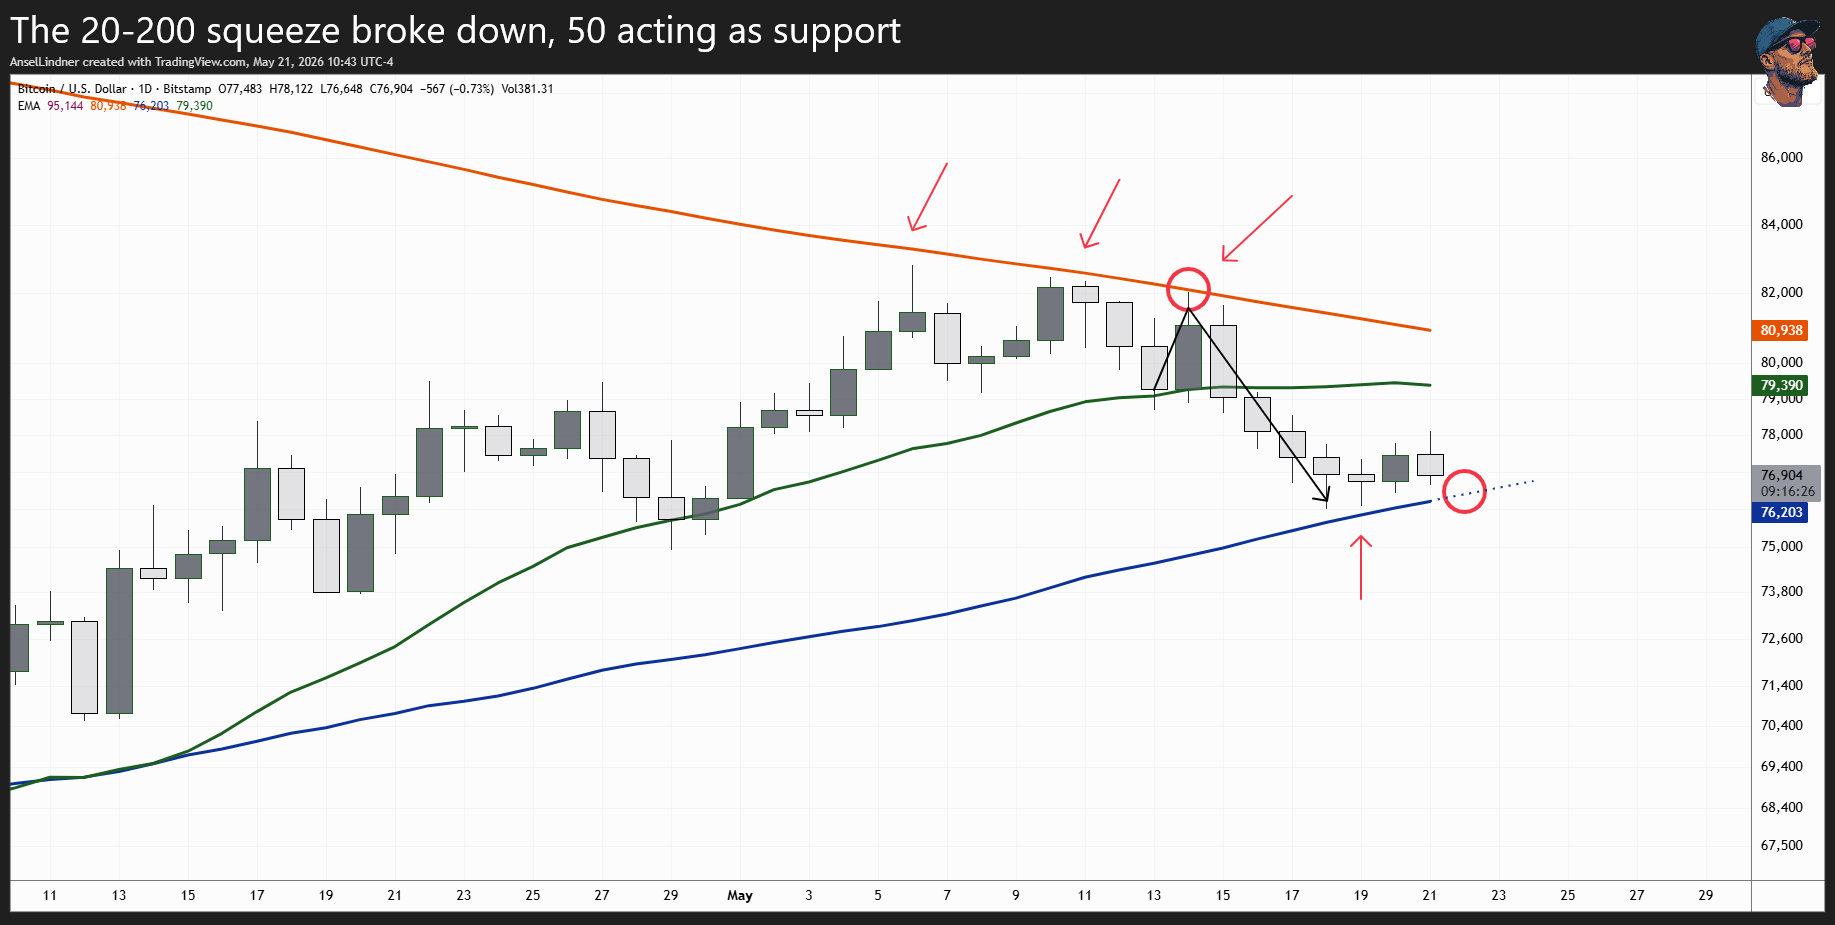
Above we also see that it took several attempts at the 200-day to actual touch it (upper red circle). That's due the same dynamic in the reverse direction. Perhaps, we can expect price to at least touch the 50 very soon (lower red circle). Of it holds is another question.
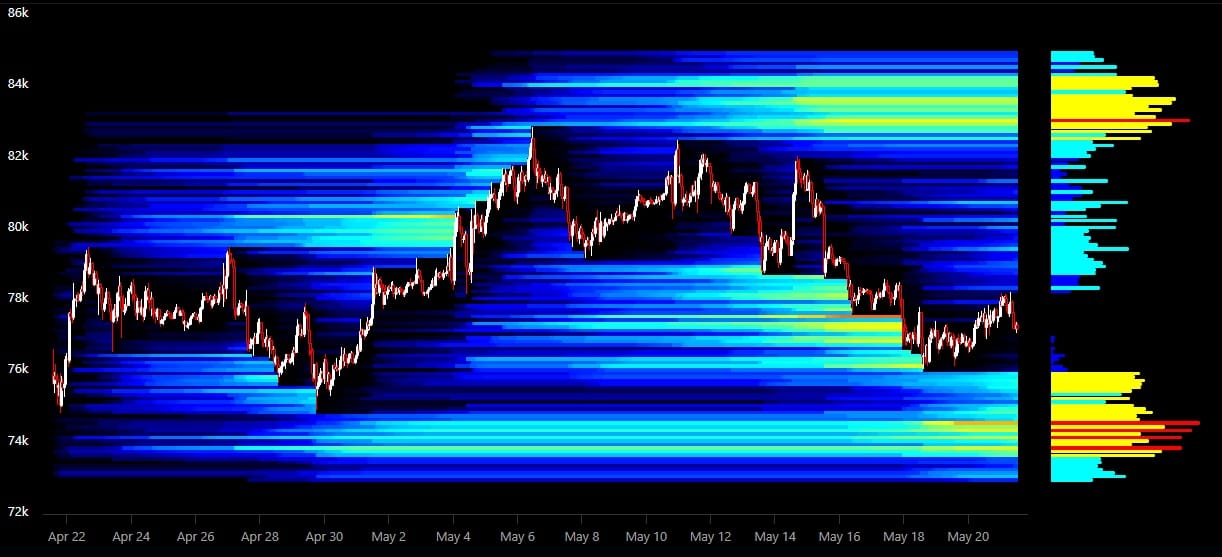
The bounce has been lackluster, telling me price might want to go lower. There is some big liquidity down at $73k, so odds of hitting that level is high.
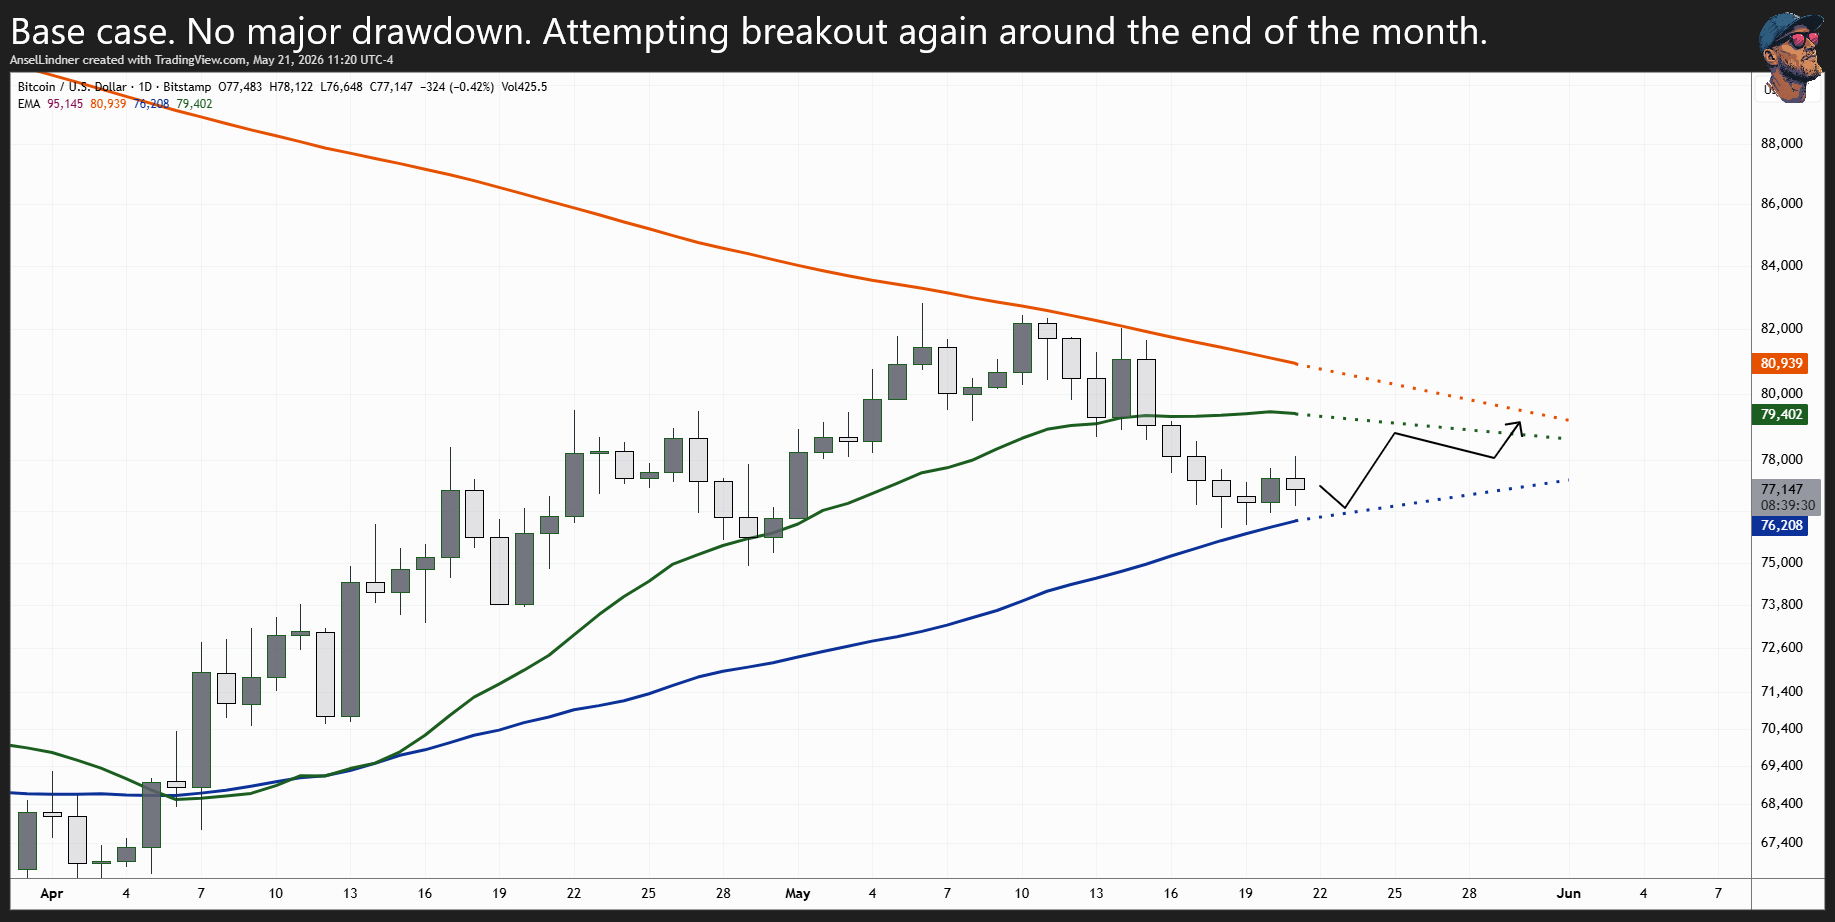
ATM, I don't expect a significant sell off, but as we move into the end of the month we could see some more volatility. My base case is holding in the $70s for 2-3 weeks. Discussion will again turn to potential breakout as we move into June. By that time, the 200-day will be below $80k, making that breakout easier. Chipping away at resistance as we try to approach the next major target at $85-90k.
200- and 365-day Moving Averages
This is a little fun project I was looking at this week. Long period moving averages. Of course, everyone knows the 200-day. That's a very well known long-term trend indicator. Bear market if below the 200-day and bull market if above. But I also bring the even longer 365-day to judge the movement of price deeper in the bear markets.
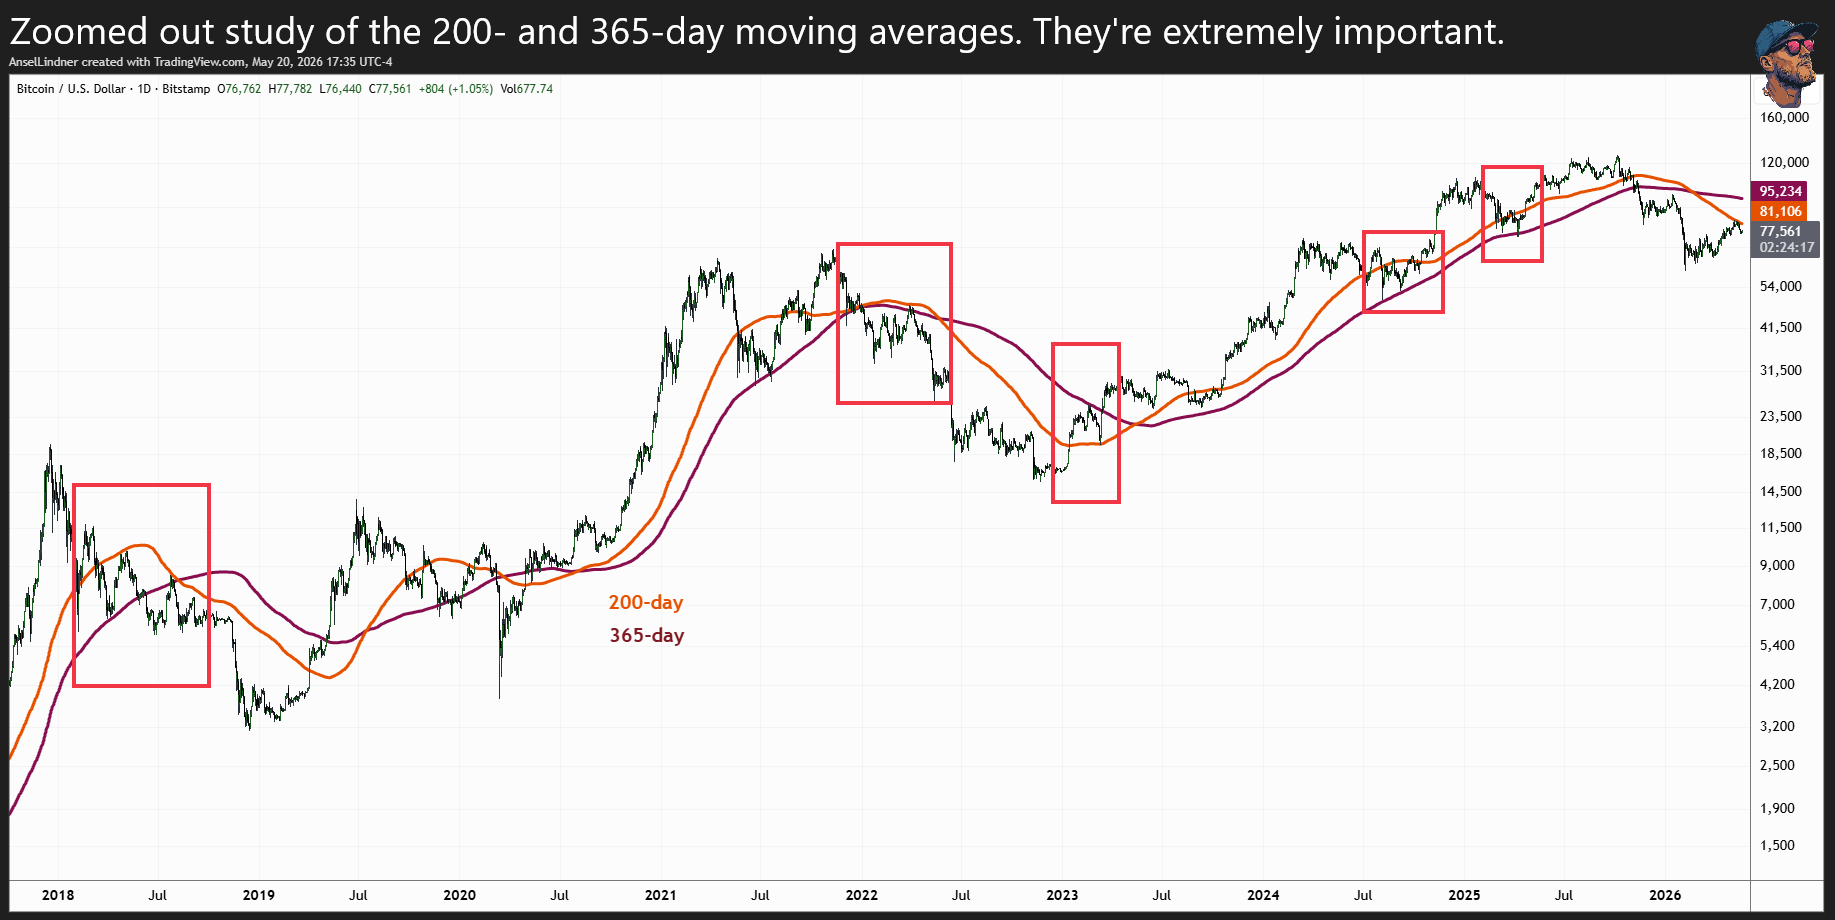
I was very surprised when the 365-day appeared to play a very important role in the first half of the bear markets. Breaking the 200-day, but the 365 seems to signal, "100%, we're in a bear market."
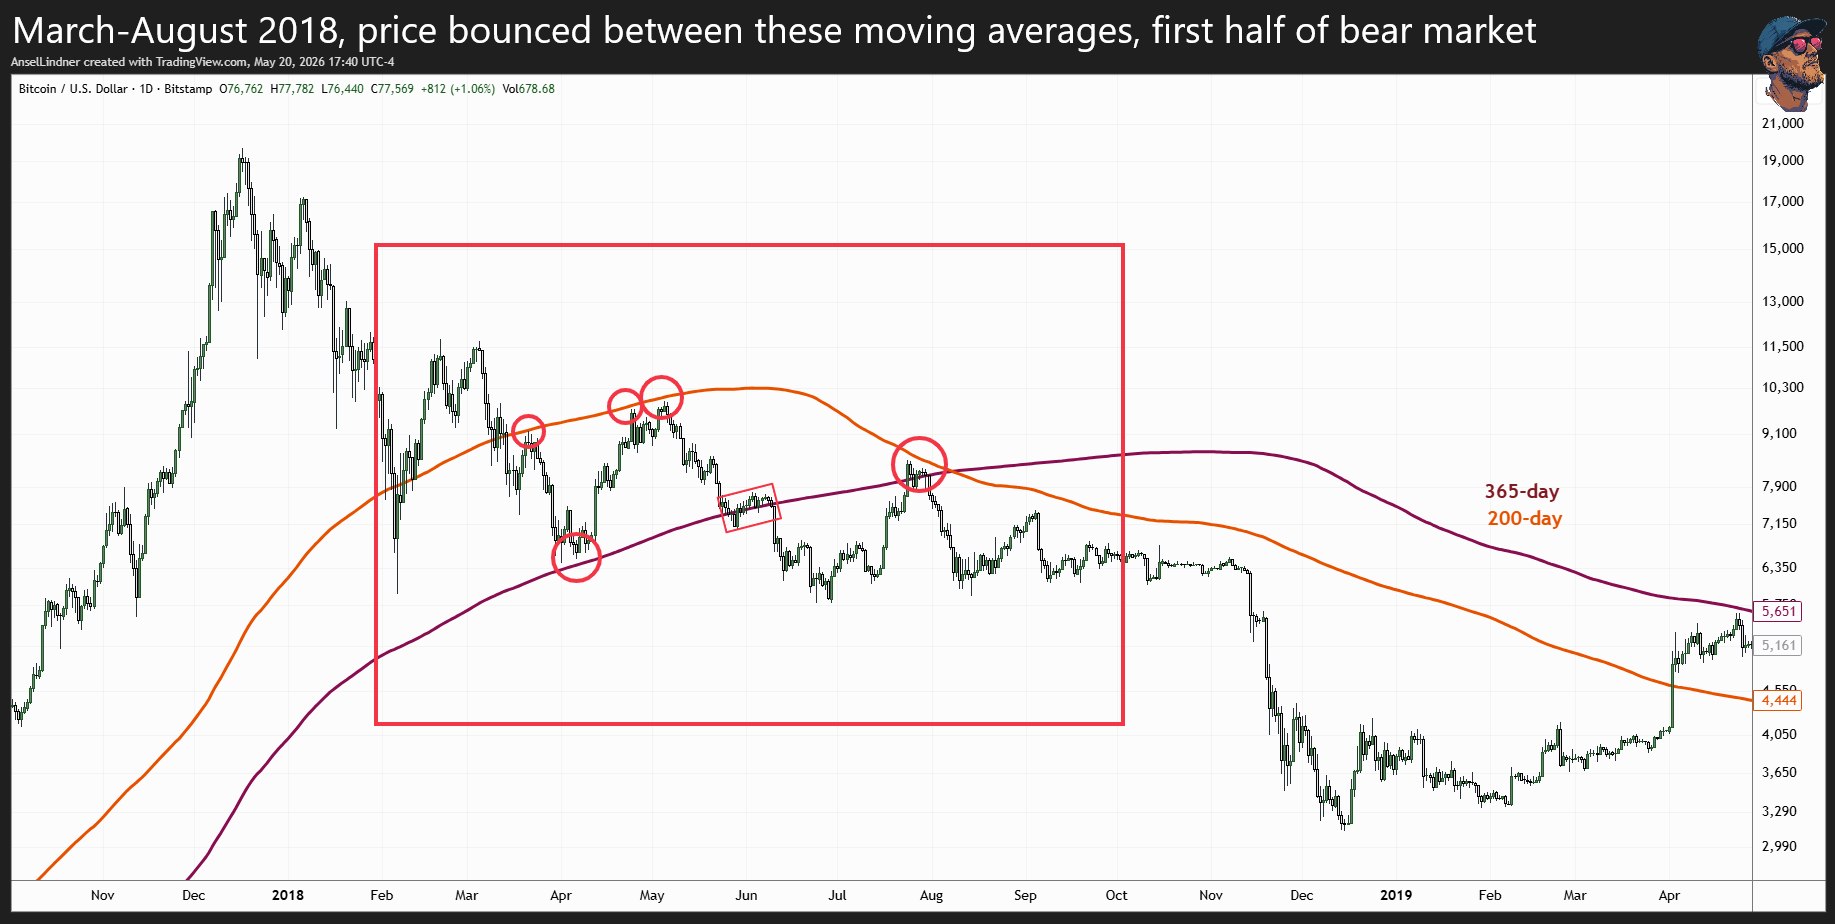
As you can see below, back in 2018, price bounced between the two MAs, resisted breaking below the 365, but that was all she wrote.
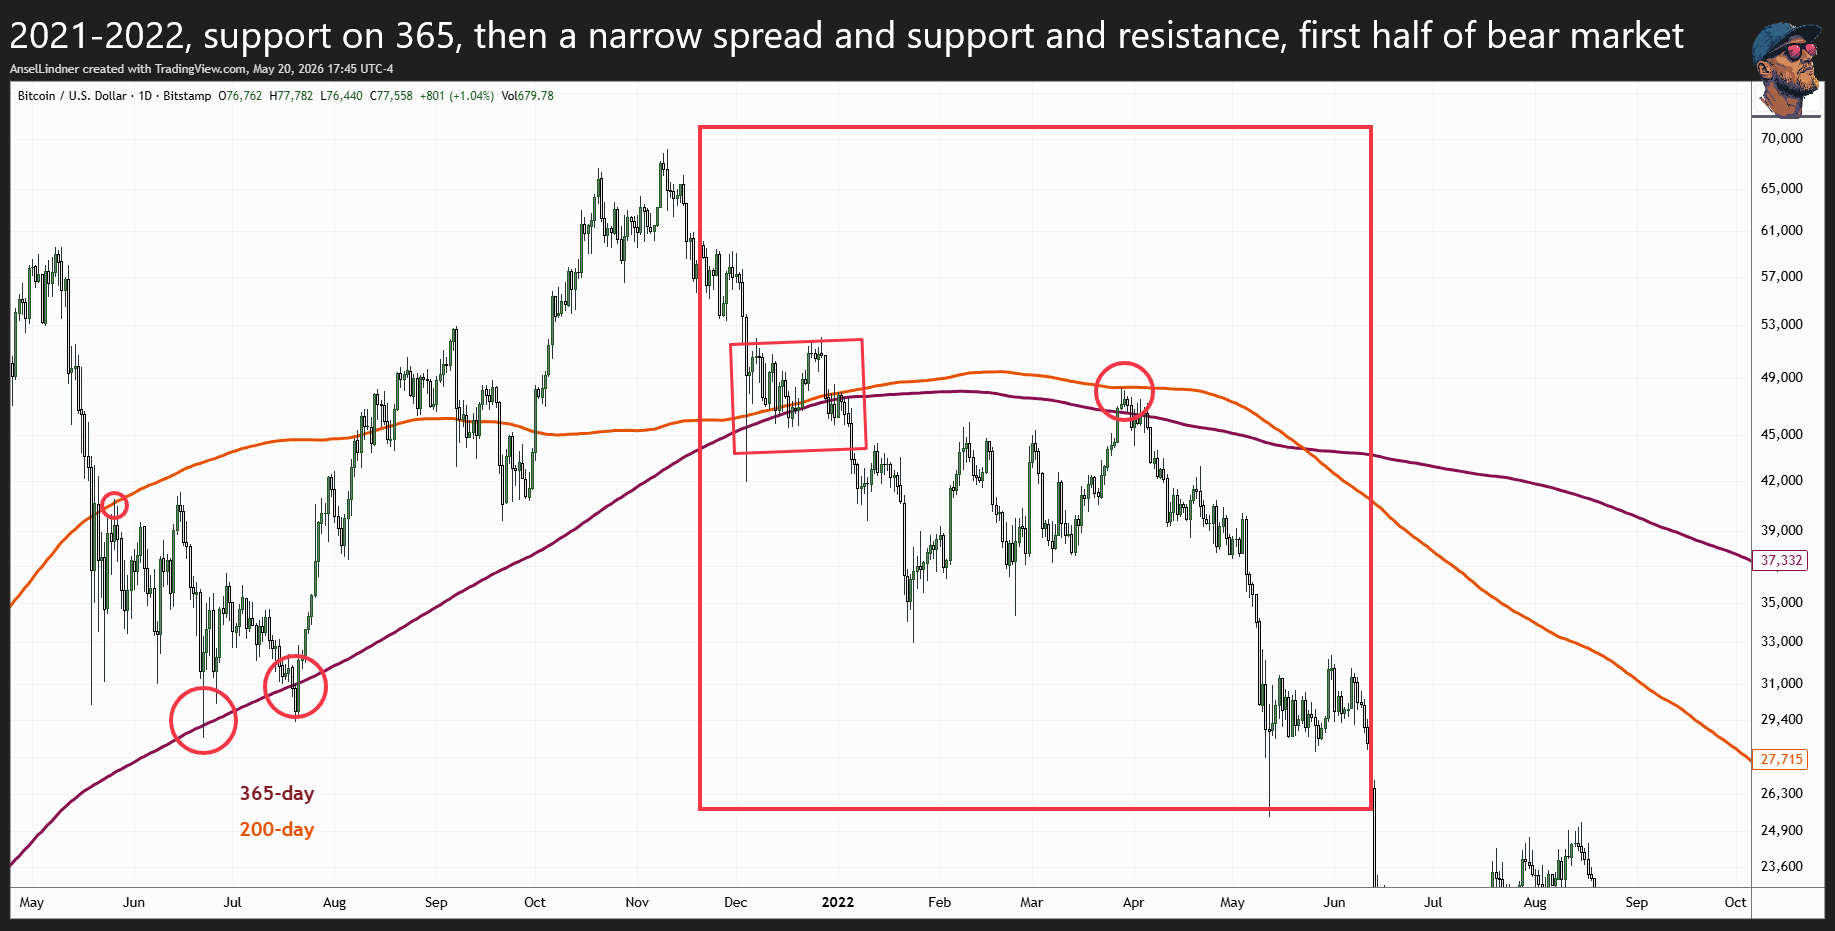
Again in 2021-2022, before and after the secondary high the 365-day provided support before a reattack of the ATH. Then, as the the MAs spread squeezed price found initial support, and then resistance. Just like back in 2028. And again, it was the first half of the bear market.
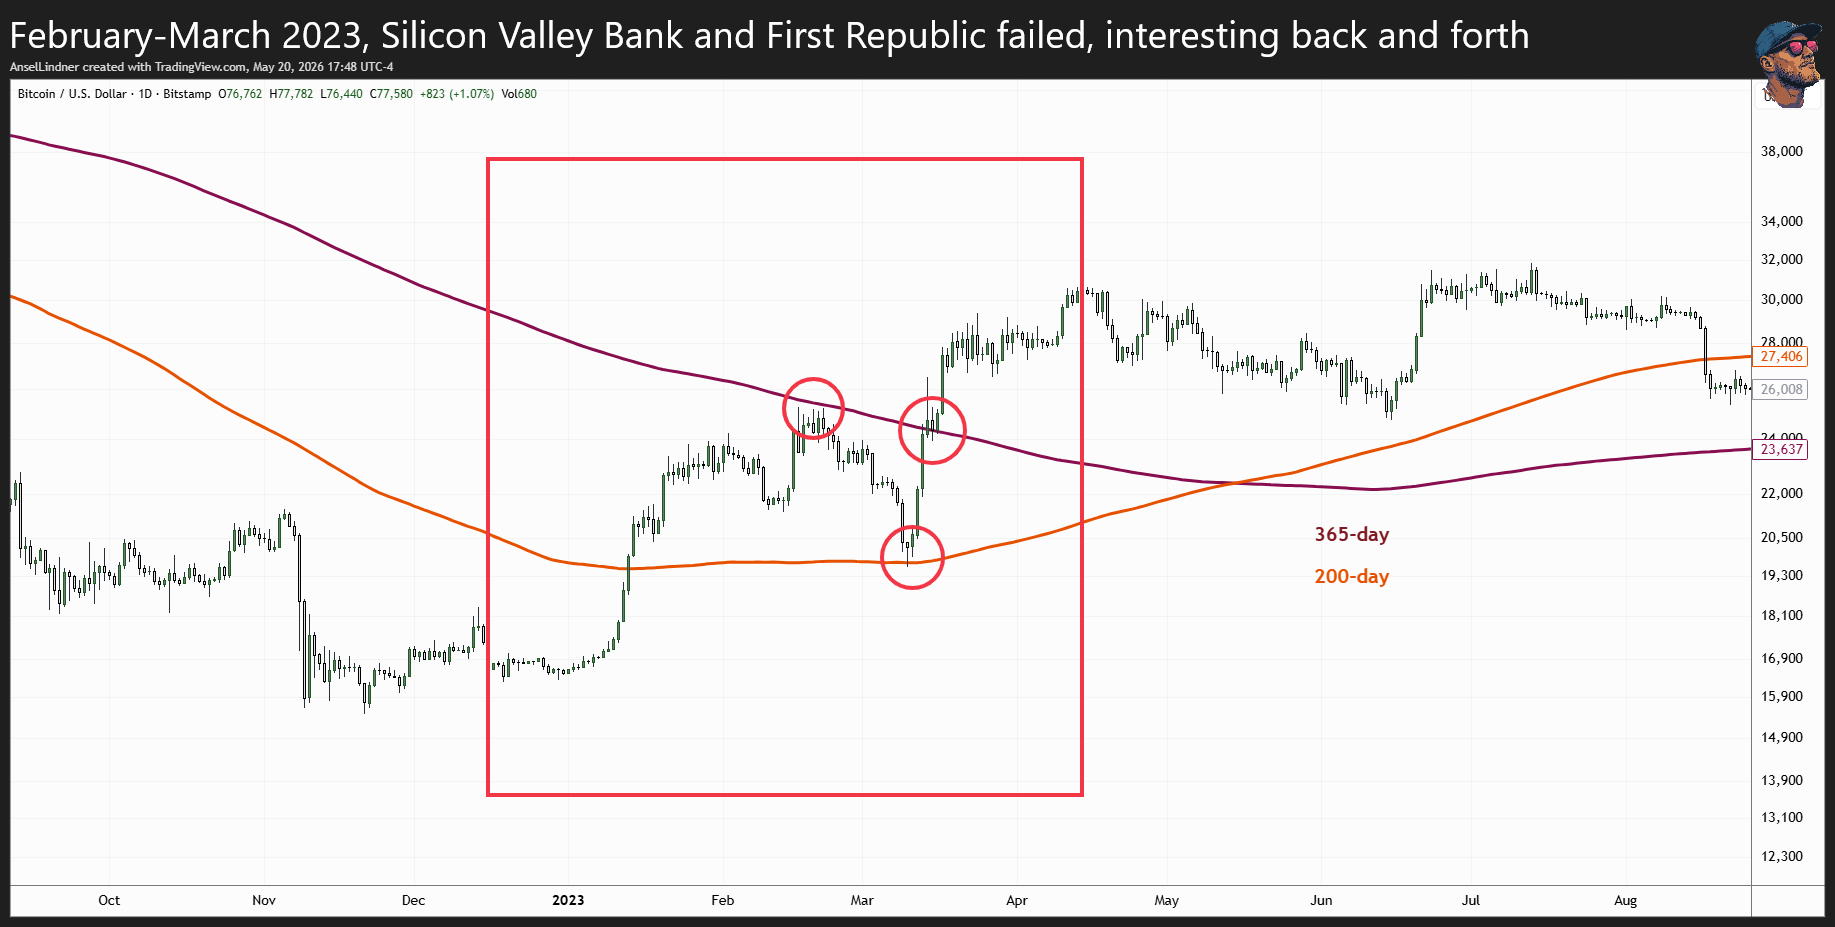
A few other cases, the next one from 2023, testing the 365 as resistance, the 200 as support, before finally breaking out in March after the banking crisis of that year.
In 2024-2025, the 200 repeated acted as resistance, and the 365 as support.
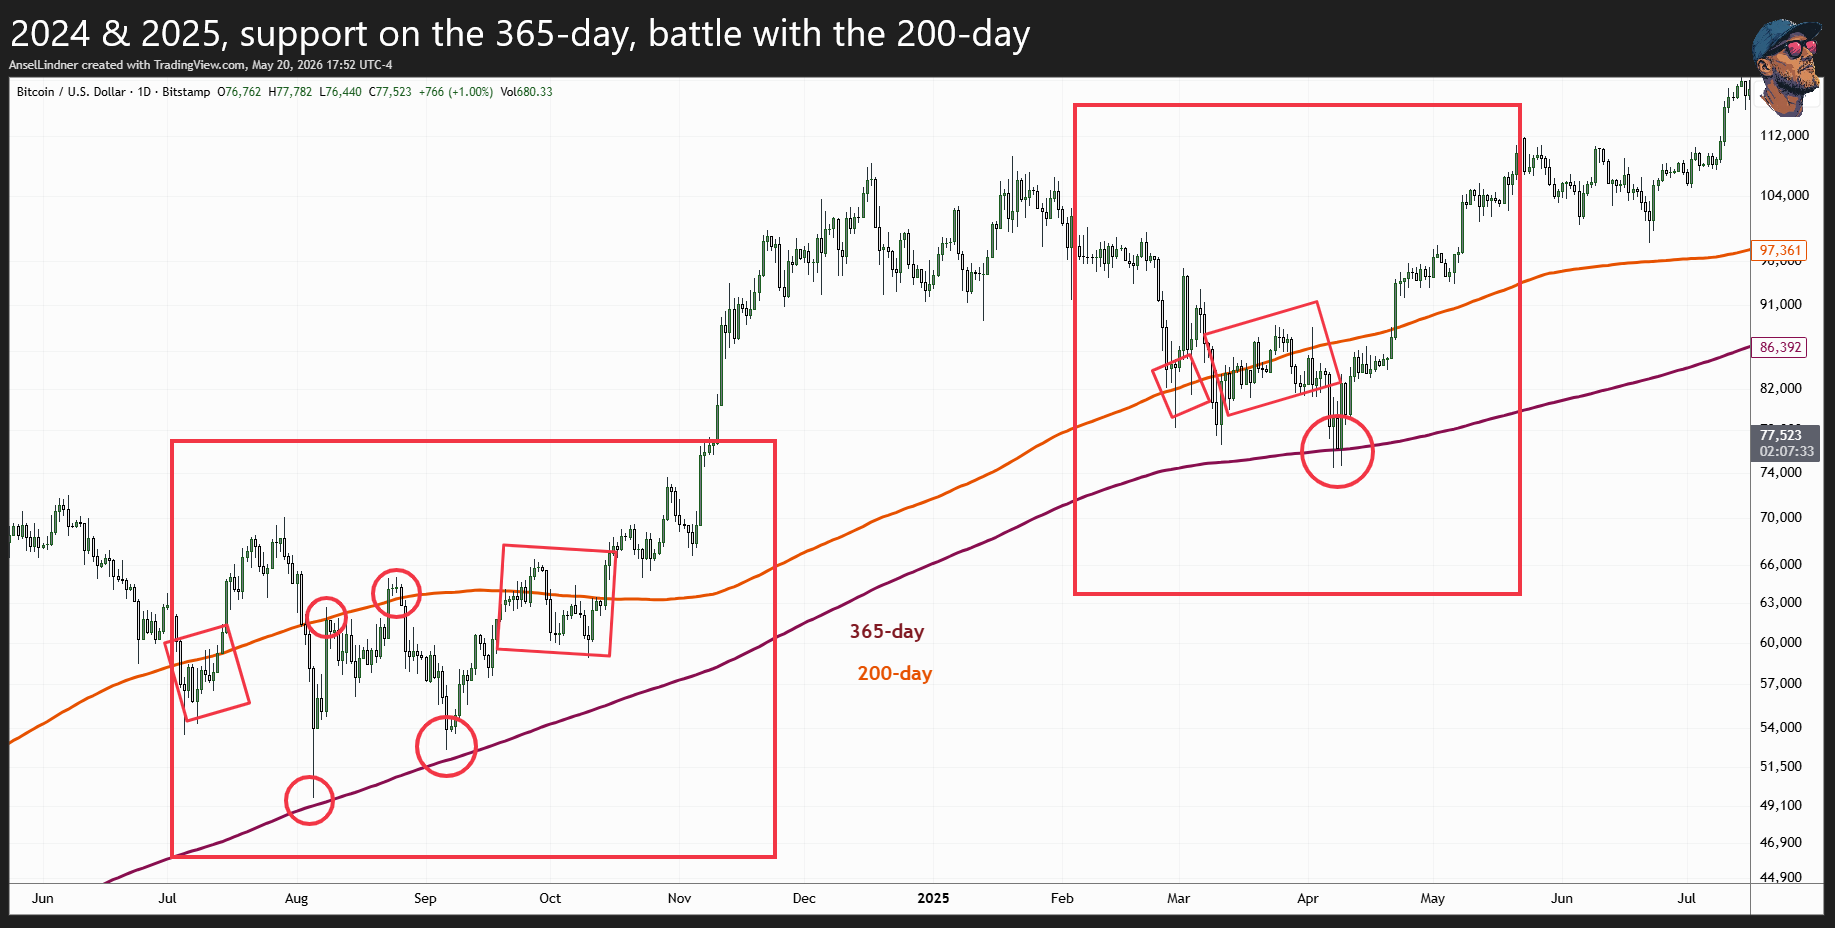
This relationship is simply amazing. The 365-day acts as support way more than just by chance.
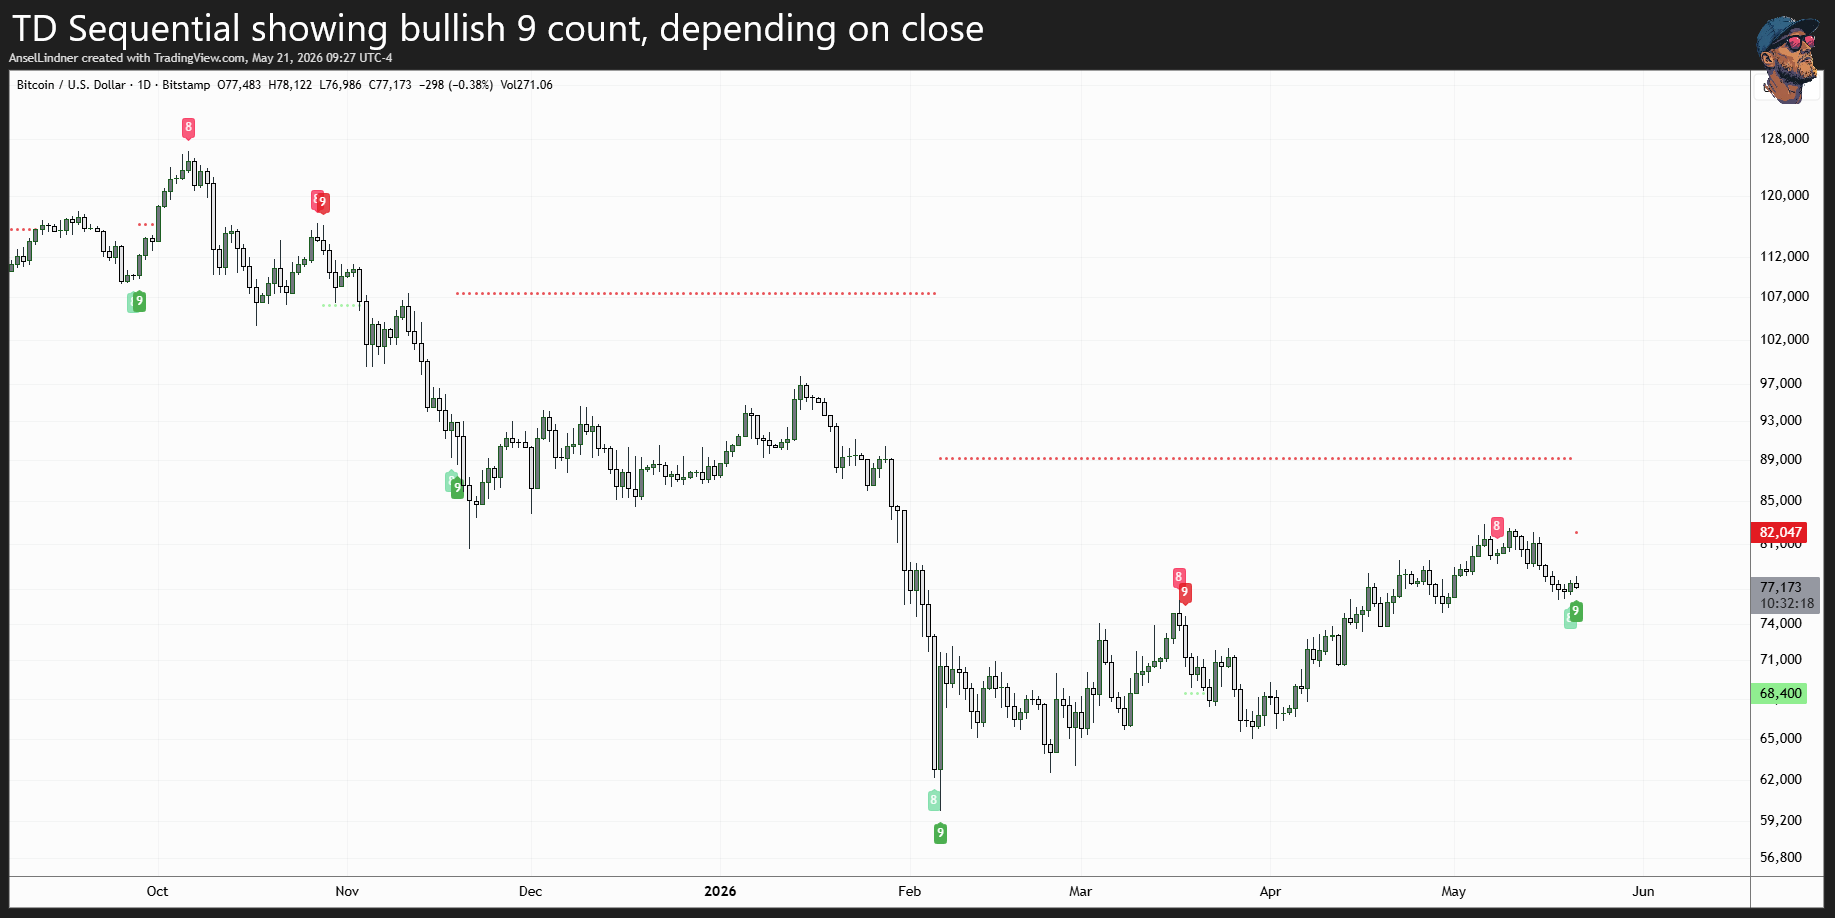
TD Sequential
A real quick look at the daily TD Sequential, only because it's hitting a bullish 9. This is a time-in-trend indicator. A 9 count tends to mark the extent of a move and a correction is highly probable. Note: price has to close today under $77,412 (close 4 days prior) to lock in the 9. If it closes above that, the count will be reset.
Whatever the case, this is another piece of data leaning bullish.
HODL strong. Thanks for reading! PLEASE SHARE!
A
- Podcast links and Socials
- Disclaimer
- Feedback form
- Original charts and analysis are CC-BY