Bitcoin Breaks Containment
Bitcoin breaks above key resistance as Ichimoku and PMI signal early-stage bullish momentum

Bitcoin & Markets | May 4, 2026
Exploring the intersection of bitcoin, macroeconomics, markets, biology, and politics within the evolving global order.
Bitcoin Charts
The bitcoin price has broken out above the Ichimoku Cloud (extended settings) for the first time since the bear market began. That’s a major shift. Breakouts above the cloud typically lead to strong continuation moves, with the top of the cloud acting as support on any back-test.
The weekly Cloud (not shown) is also turning bullish. Price has entered the cloud from below and is now threatening an edge-to-edge move, implying a potential run toward $93k.
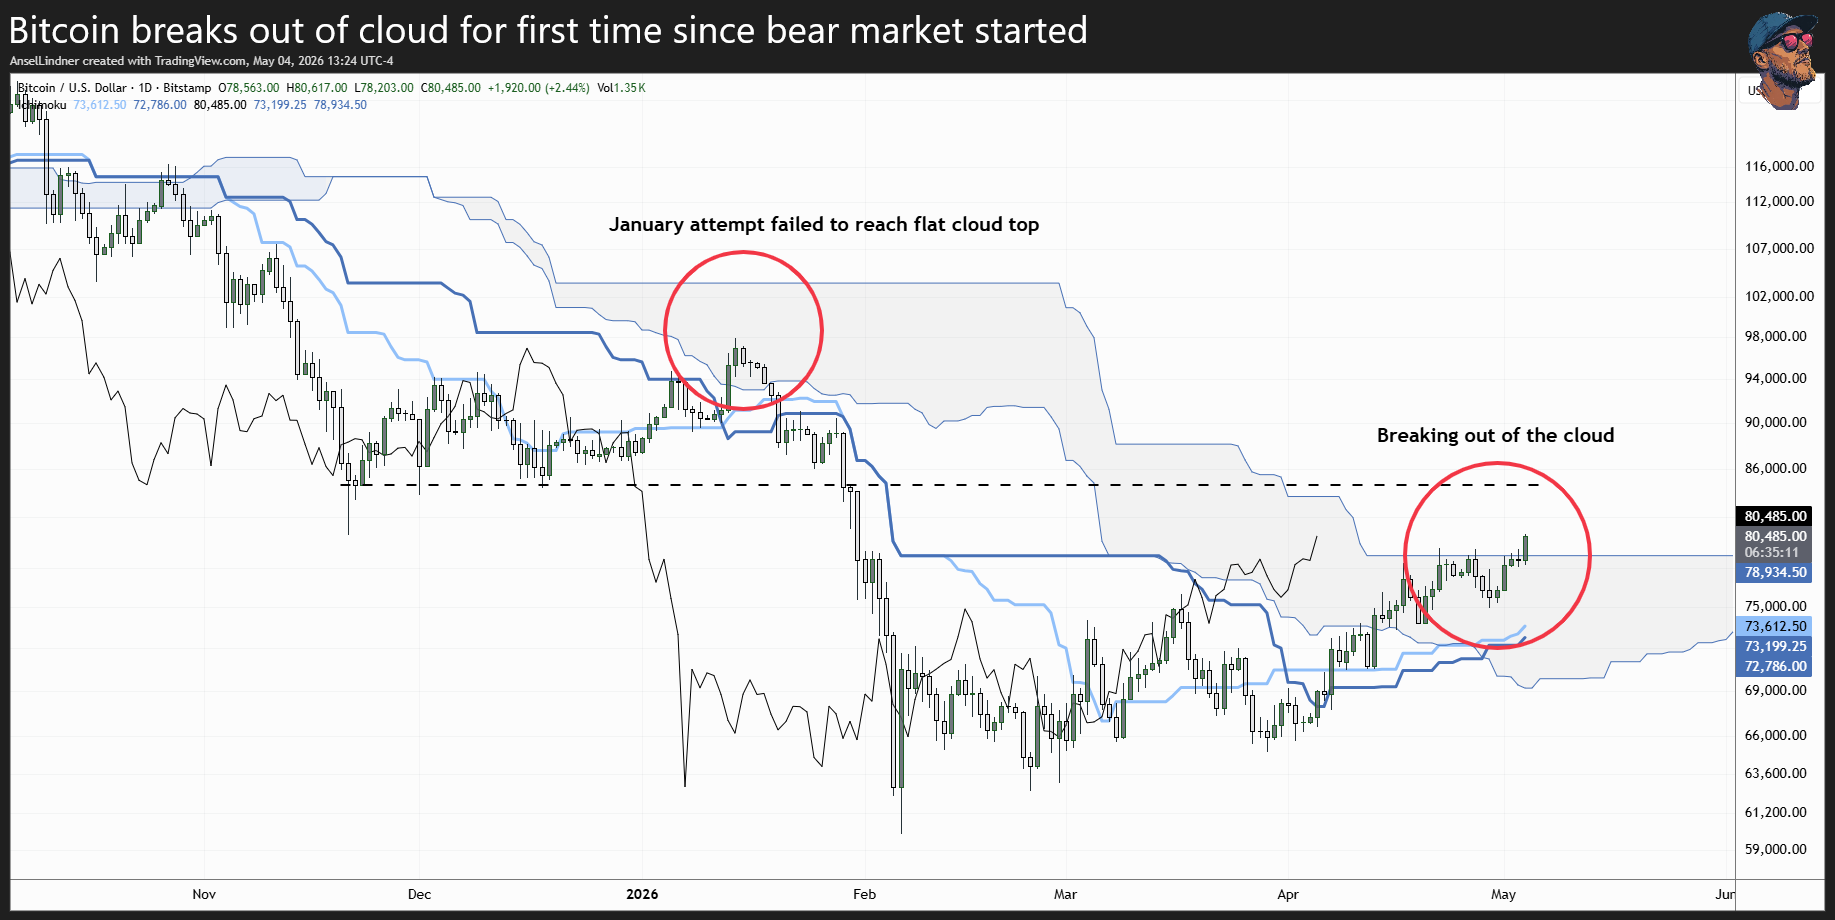
On the chart above, I’ve marked horizontal resistance around $85k. I also highlighted (red circles) how this move differs structurally from the January fake out.
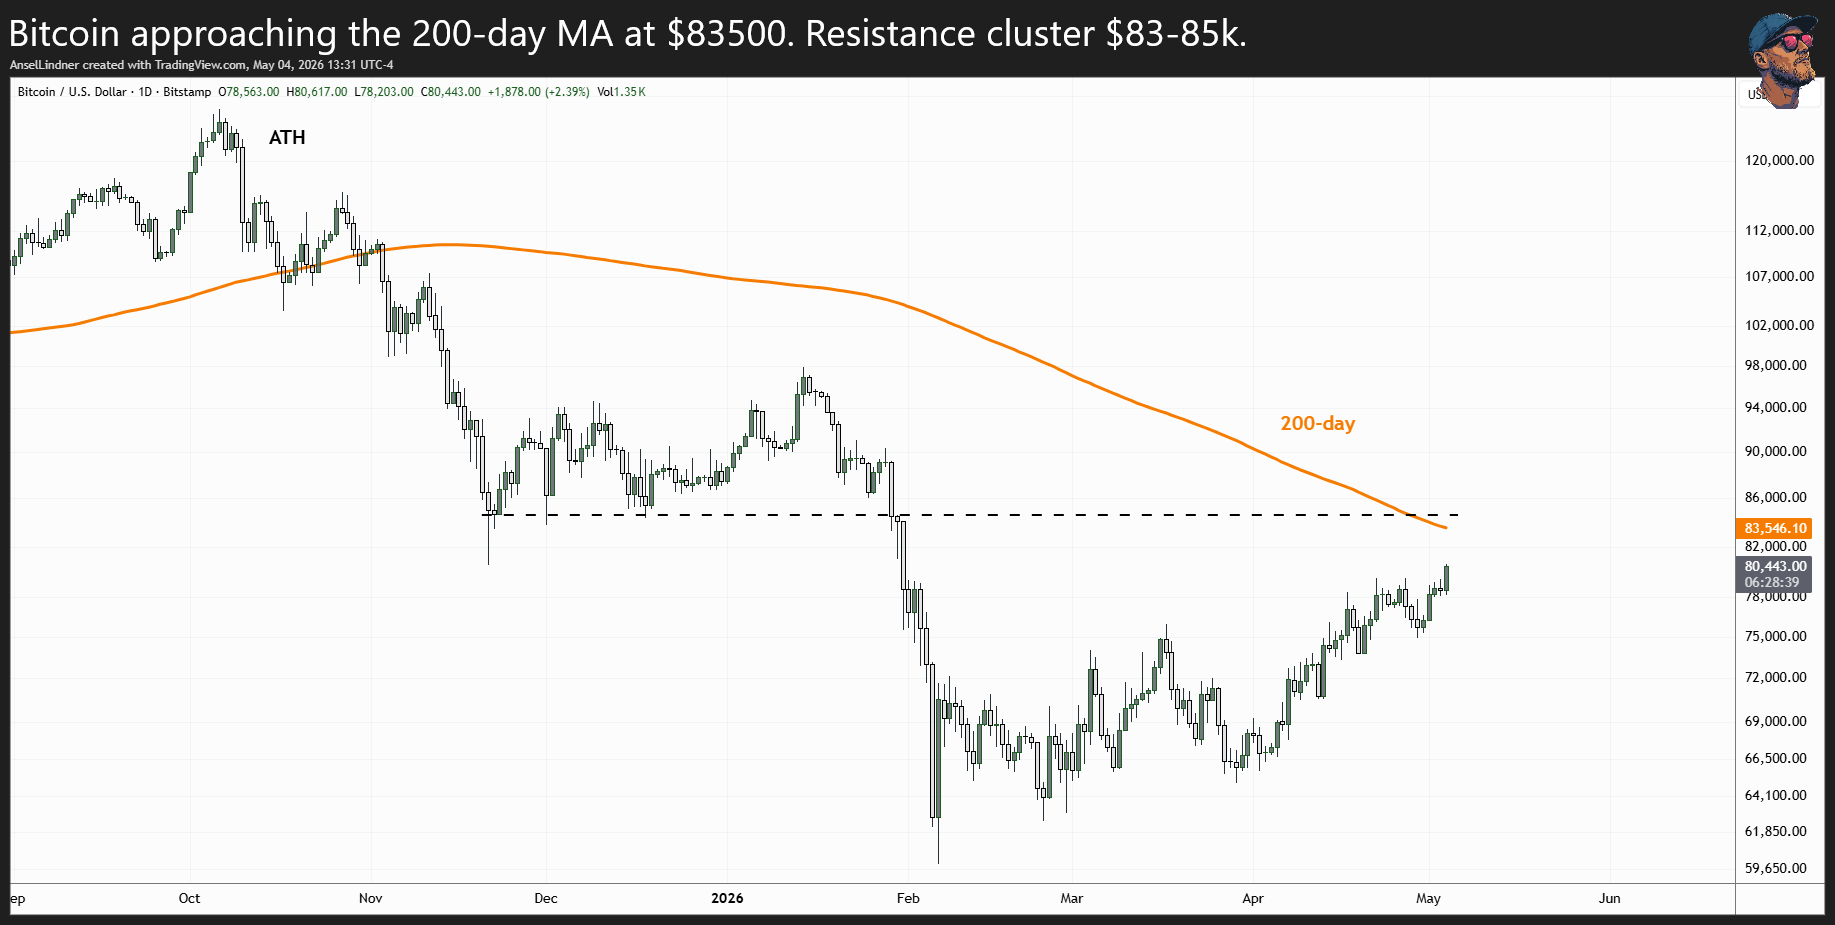
Next up is the 200-day moving average. Price is pushing right into it, now sitting just below that same horizontal resistance. This creates a tight cluster of levels in the $83–85k range, which should act as a magnet for price in the near term.
Other Considerations
A few additional charts are worth watching.
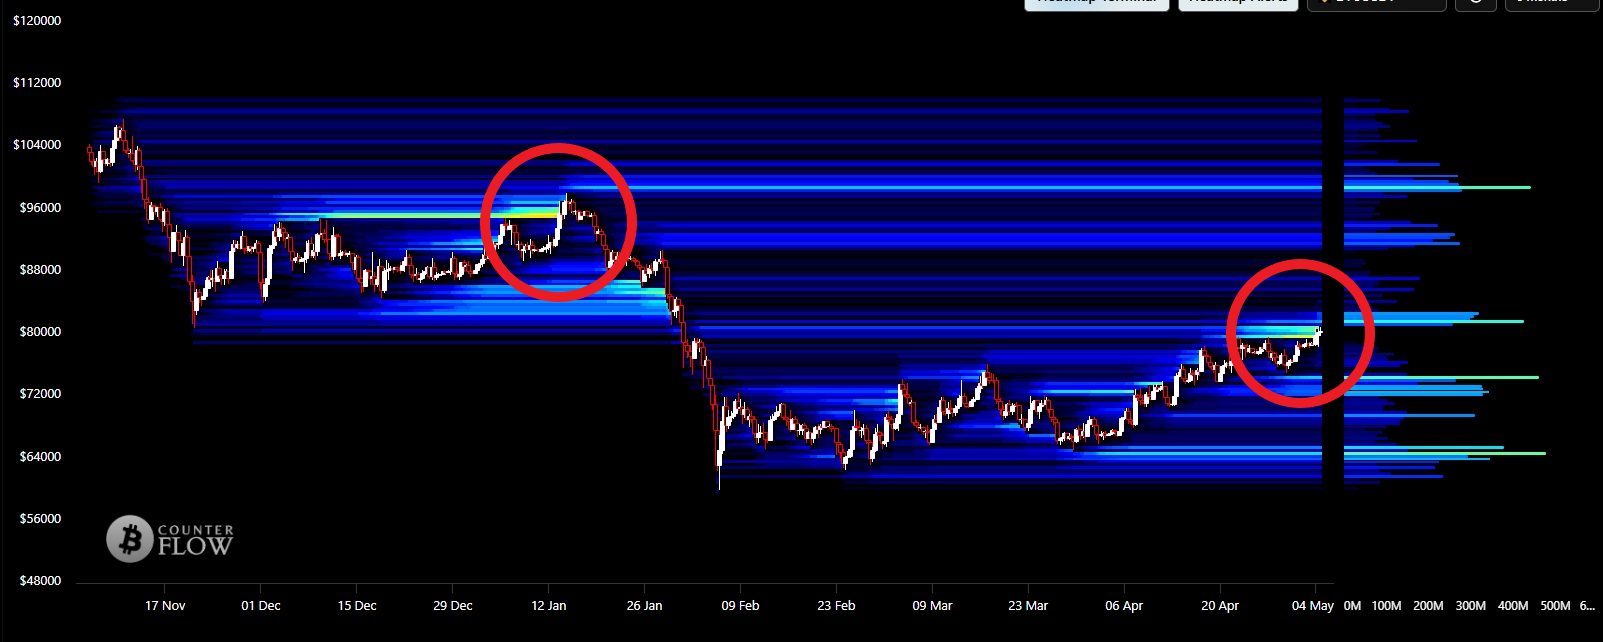
First is the bitcoin heat map from Counter Flow. We’ve been tracking the $79,650 level closely. What gives me some pause is the similarity to January in terms of liquidation structure. The futures market remains a major driver of bitcoin price action, and these liquidation clusters tend to act like magnets.
In January, price swept those levels and then reversed sharply. Today, the liquidation cluster around $79,650 could resolve in a similar way. I view that as a lower-probability outcome, but it’s still on the table.
The addition of PMI to bitcoin analysis was one of the more genuinely useful macro overlays since stock-to-flow. I’m less convinced by the Bitcoin Power Law, despite its popularity.
PMI surveys thousands of purchasing managers, asking whether business conditions are improving or deteriorating month over month. A reading below 50 signals contraction, while above 50 signals expansion, making it a classic boom-bust indicator.
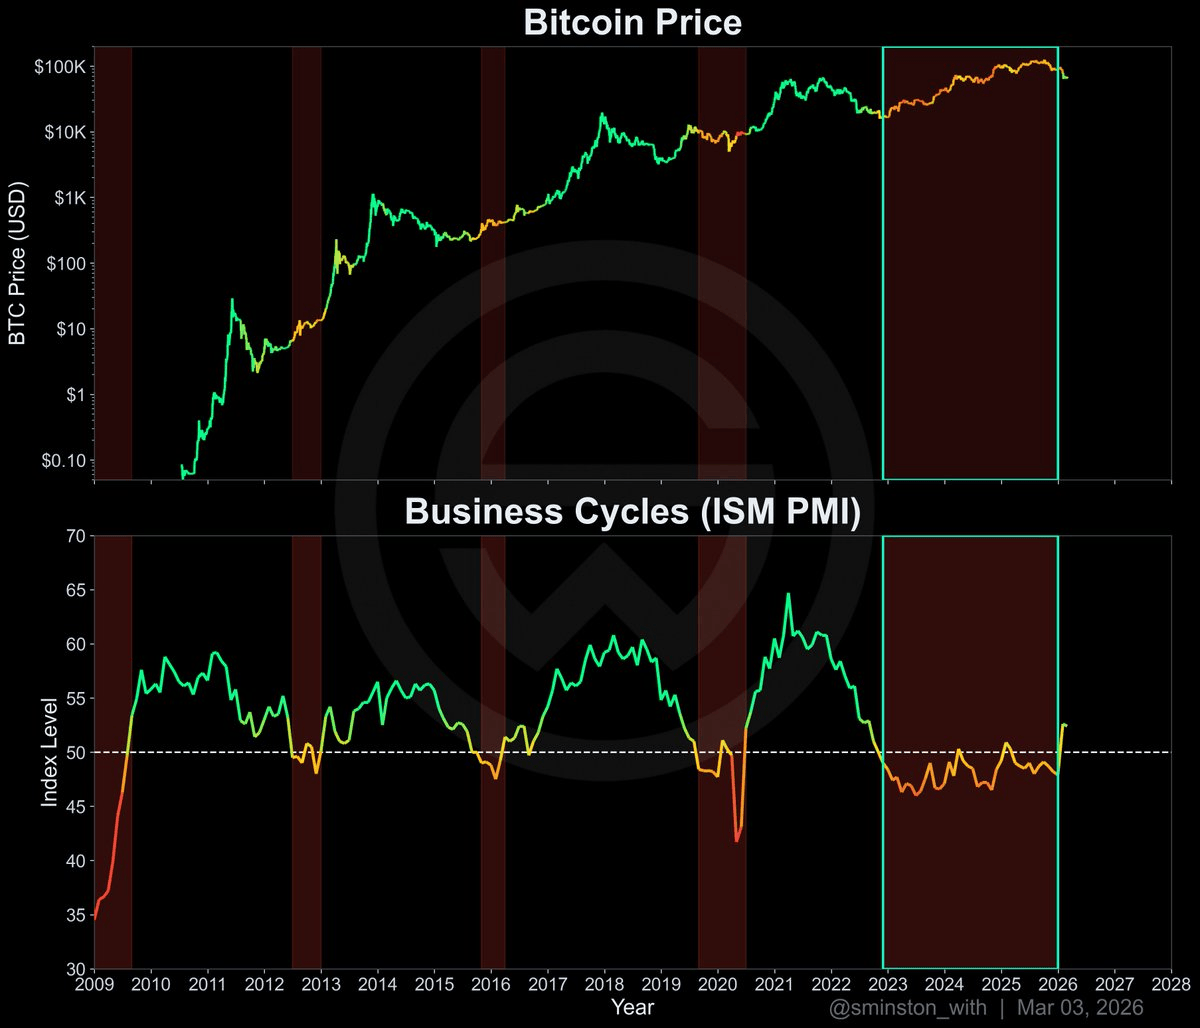
As you can see above, we might be able to say there's been no bull market yet this cycle, since there was not a corresponding expansion in the PMI. Bitcoin rallied the last 3 years while PMI was contracting. However, in the last 3 months, PMI has turned positive. It's not 100% conclusive, but it is the first long-term bullish sign in months.
HODL strong. Thanks for reading! PLEASE SHARE!
A
- Podcast links and Socials
- Disclaimer
- Feedback form
- Original charts and analysis are CC-BY