Bitcoin Fundamentals Report #258
Bitcoin is dominated by futures market manipulation? Strong dollar, yields, and oil, versus weak bitcoin and stocks. Plus price analysis and mining sector news.


September 25, 2023 | Block 809,314
Snapshot of Bitcoin
| General Bitcoin Headlines | |
| Weekly trend | Slow sell off |
| Media sentiment | Positive |
| Network traffic | Elevated, but declining |
| Mining industry | Surging |
| Days until Halving | 204 |
| Price Section | |
| Weekly price* | $26,316 (-$986, -3.6%) |
| Market cap | $0.514 trillion |
| Satoshis/$1 USD | 3,793 |
| 1 finney (1/10,000 btc) | $2.64 |
| Mining Sector | |
| Previous difficulty adjustment | +5.4842% |
| Next estimated adjustment | -2% in ~7 days |
| Mempool | 175 MB |
| Fees for next block (sats/byte) | $0.85 (23 s/vb) |
| Median fee | $0.66 |
| Lightning Network** | |
| Capacity | 4740.98 btc (-2.7%, -133) |
| Channels | 67,000 (-1.1%, -740) |
In Case You Missed It...
Member
- Dr. Copper Has Something to Say, Ethereum and Bitcoin Forecasts - Proton 3
- Predictions for 2024 and Cycles - Proton 2
Community streams and Podcast
Blog
- The Coming Multipolar World
- Demographic Collapse: Why Should We Care?
- Demographic Collapse: Several Case Studies
Headlines
This is a common trope from the gold bug space. It stems from the misunderstanding of inflation and deflation IMO. It goes like this, the Fed and USG printer go brrrr, so, as an inflation hedge gold should skyrocket, but it doesn't, therefore, it is being held down by manipulation.
If they understood the way money printing actually works, they'd understand that gold has been an inflation hedge, but there just hasn't been all that much inflation. "WHAT?!," you say, "haven't you seen M2?!" Is is more constructive to believe gold has been successfully manipulated for decades by an omniscient cabal, or that maybe you don't know how money printing works?
Back to Willy Woo,
I can put in USD collateral and sell near unlimited BTC futures contracts.
5x leverage is the norm so I would need $12b USD and absolutely NO BTC in my futures account to stop BTC price from moving upwards even if all the BTC available on exchanges were being bought up.
What he is saying is that physical futures settlement involves borrowing the underlying and selling it, in the hope you can rebuy lower when you close the short. If the price is higher, you must rebuy at the higher price and you have a loss. In a cash settled future, you don't have to borrow the underlying, you can simply open a short using USD.
Willy's argument is that this effectively "prints" synthetic bitcoin. The spot price is controlled by this synthetic bitcoin because of arbitrage. Keep printing synthetic bitcoin and the arbitrage will keep the spot price down.
Willy Woo also claims losses to be not a concern for mega-players holding the price down in this way. What he is not considering is that for every short in futures, there is a long. Also, if the overriding force is shorts controlling price, you'd expect a persistent funding rate to be against them. Meaning, shorts have to pay to keep their position on.
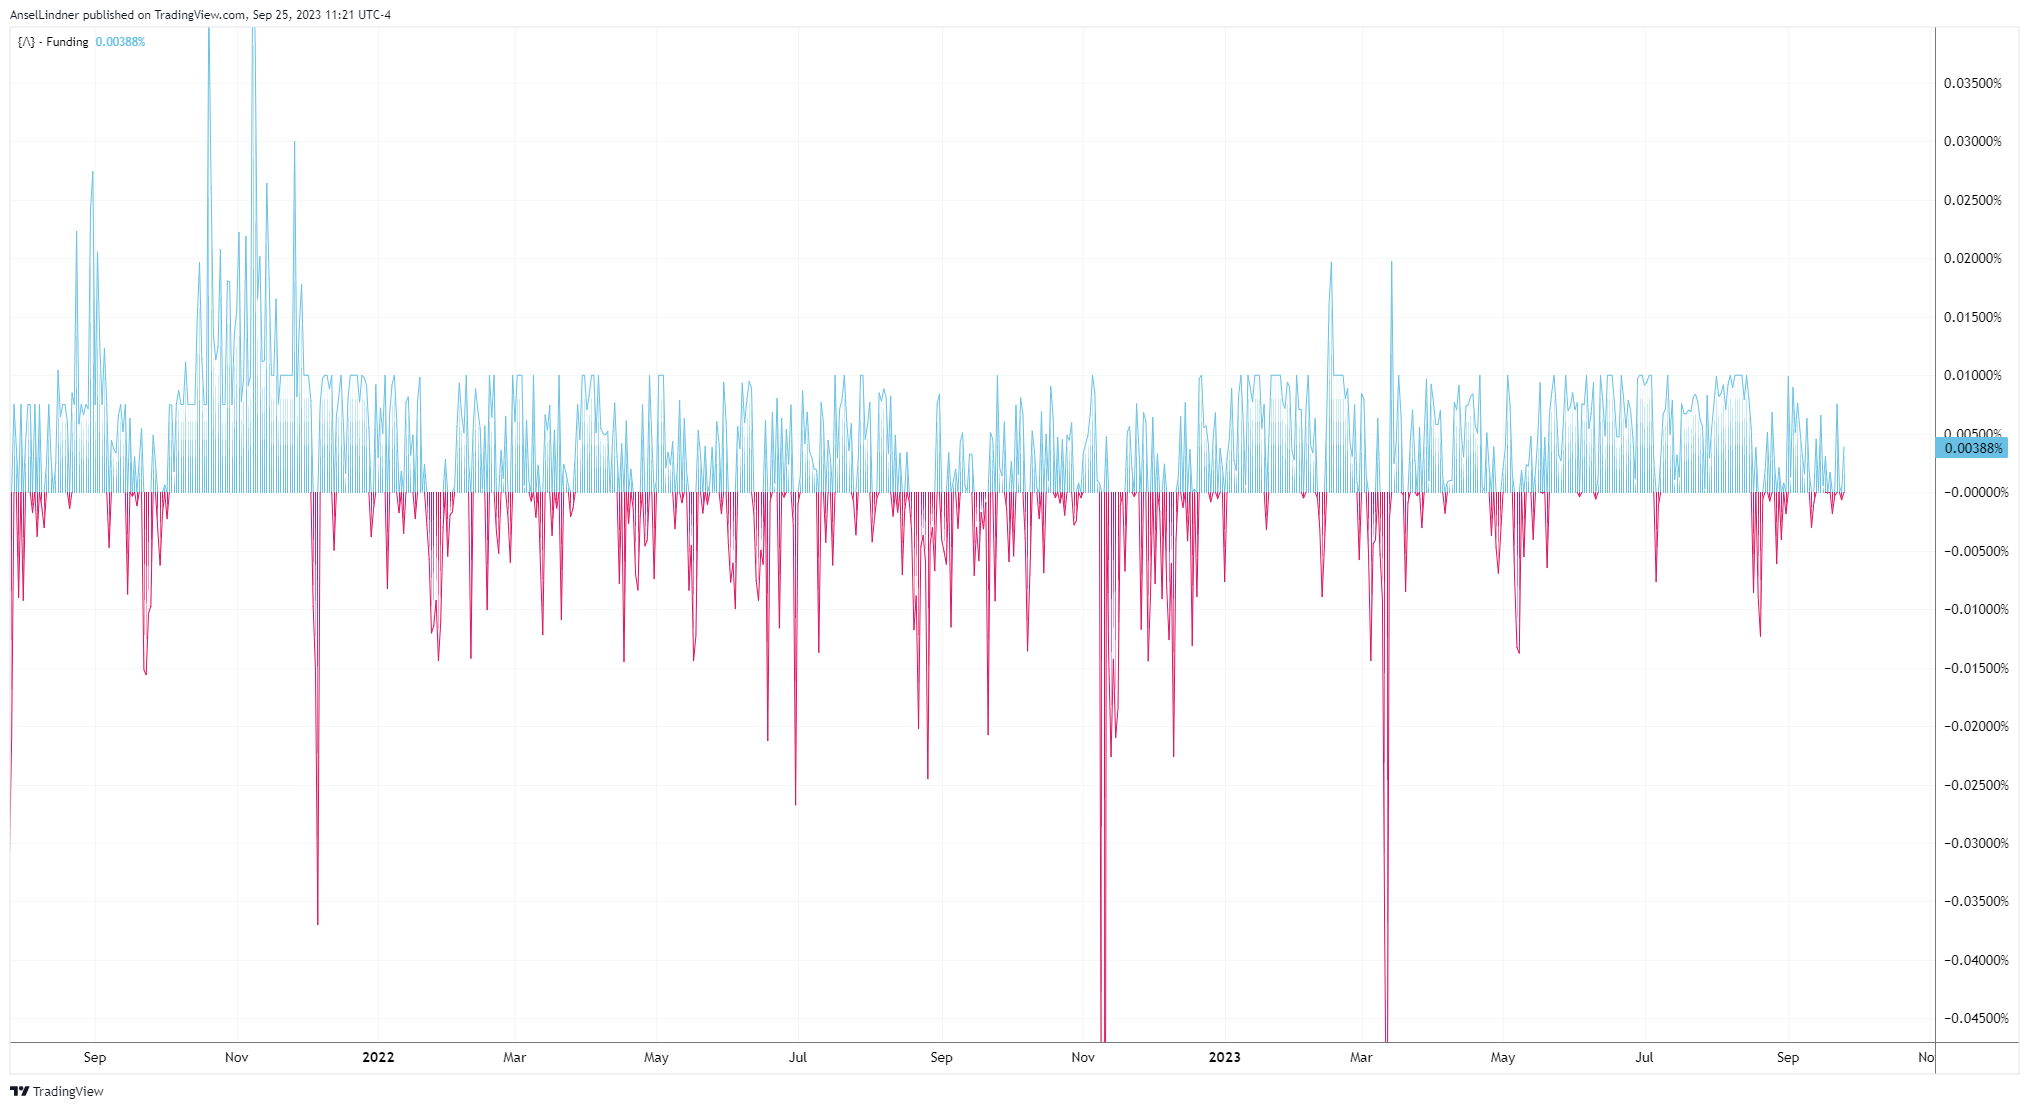
Bottom line, I disagree with him on this, and my next Bitcoin Proton will on this very subject.
This week, I wrote about Ethereum in Proton 3. I don't often write about it but there is exciting price movement, breaking below long-term support.
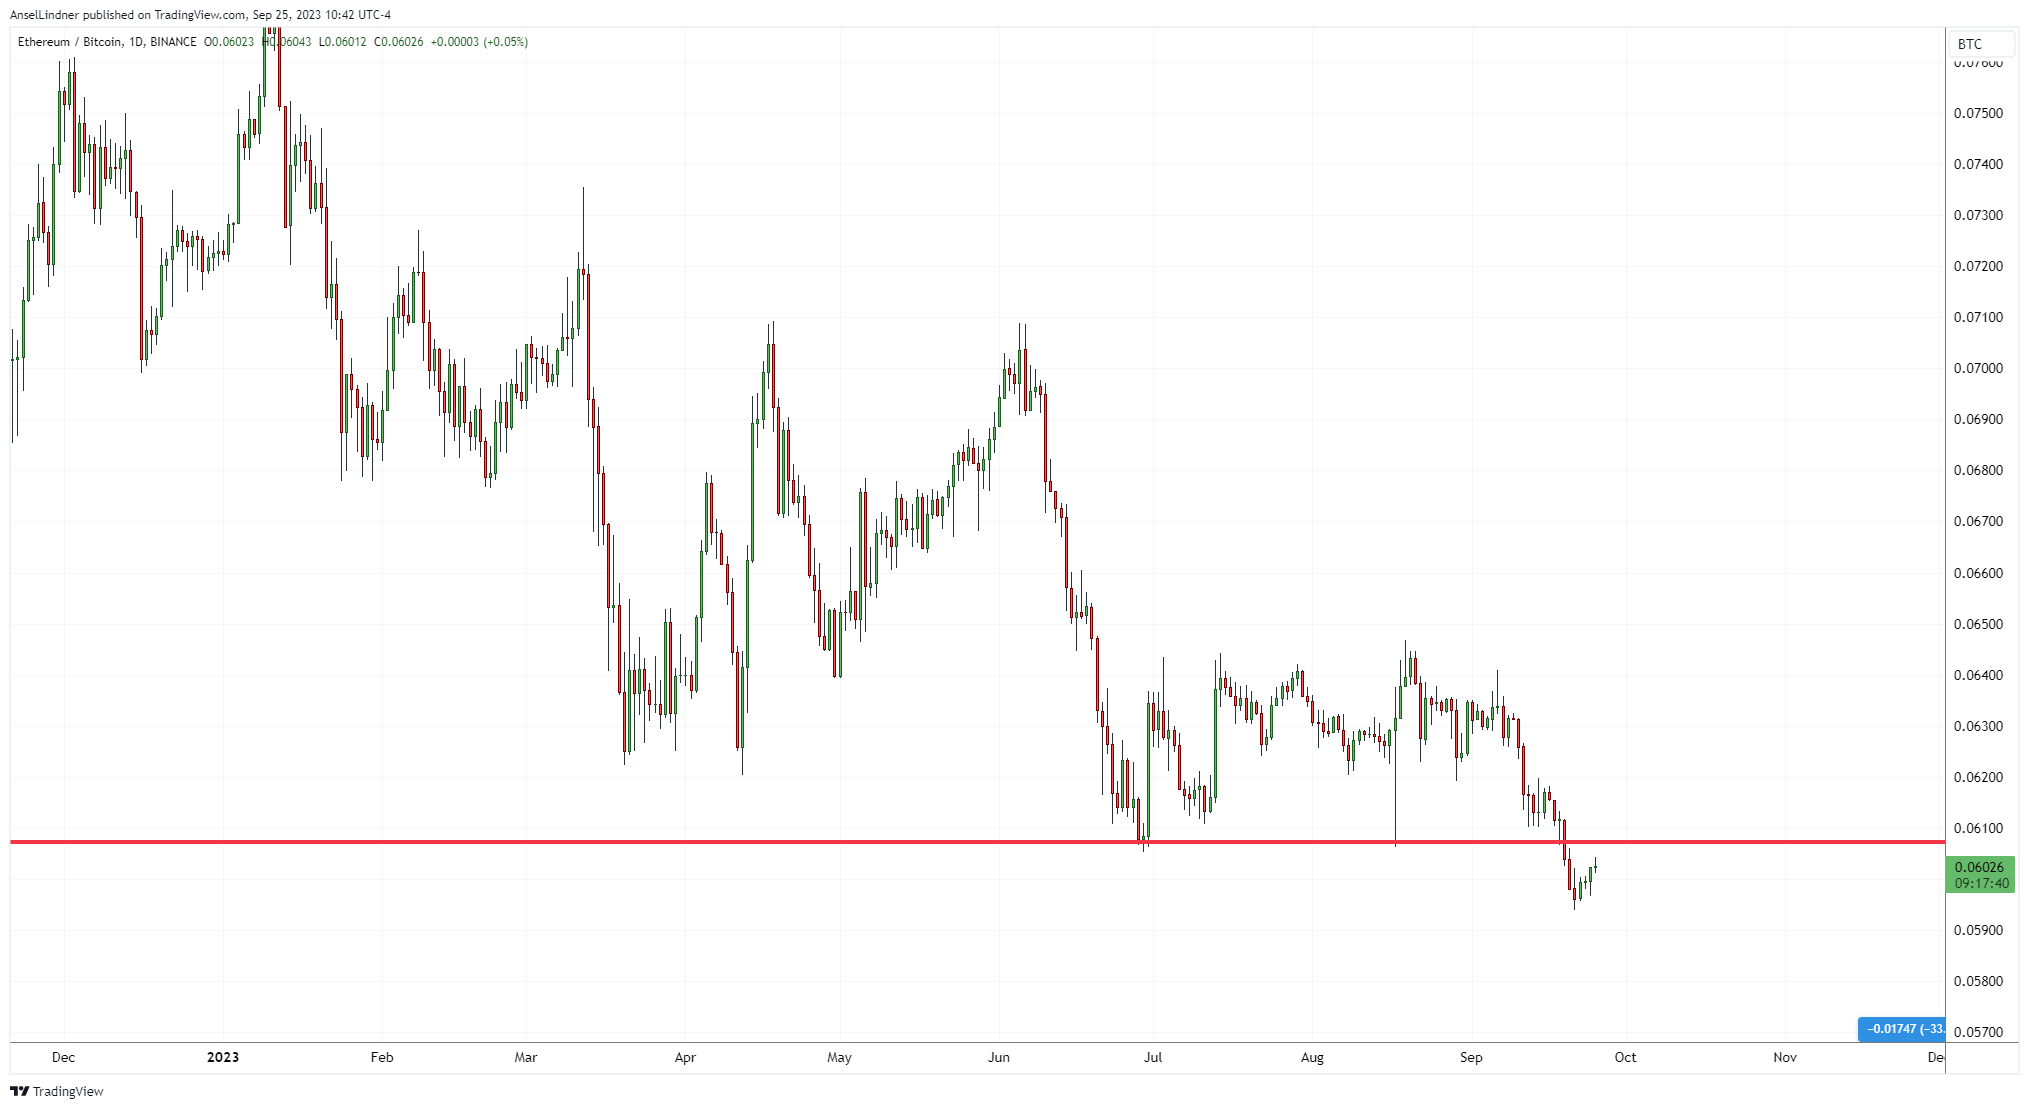
The hard times keep coming for Ethereum. Now, long time backer and reported big investor in Ethereum, JP Morgan, are calling it a disappointment.
JPMorgan analysts, led by Nikolaos Panigirtzoglou, expressed their concerns in a recent note. They pointed out that while Ethereum’s energy consumption plummeted, the supply of Ethereum was shrinking. Additionally, staking had risen significantly, with a 50% increase since the Shanghai upgrade. Surprisingly, these positive developments did not translate into increased network activity.
Gasp, almost as if actual deflation is a bad thing and removes the inflationary stimulus that built the Ponzi of Ponzi's in the first place.
If JP Morgan really is a big investor and backer of Ethereum, it goes to show how dumb it is to believe in all these elite conspiracies.
Macro
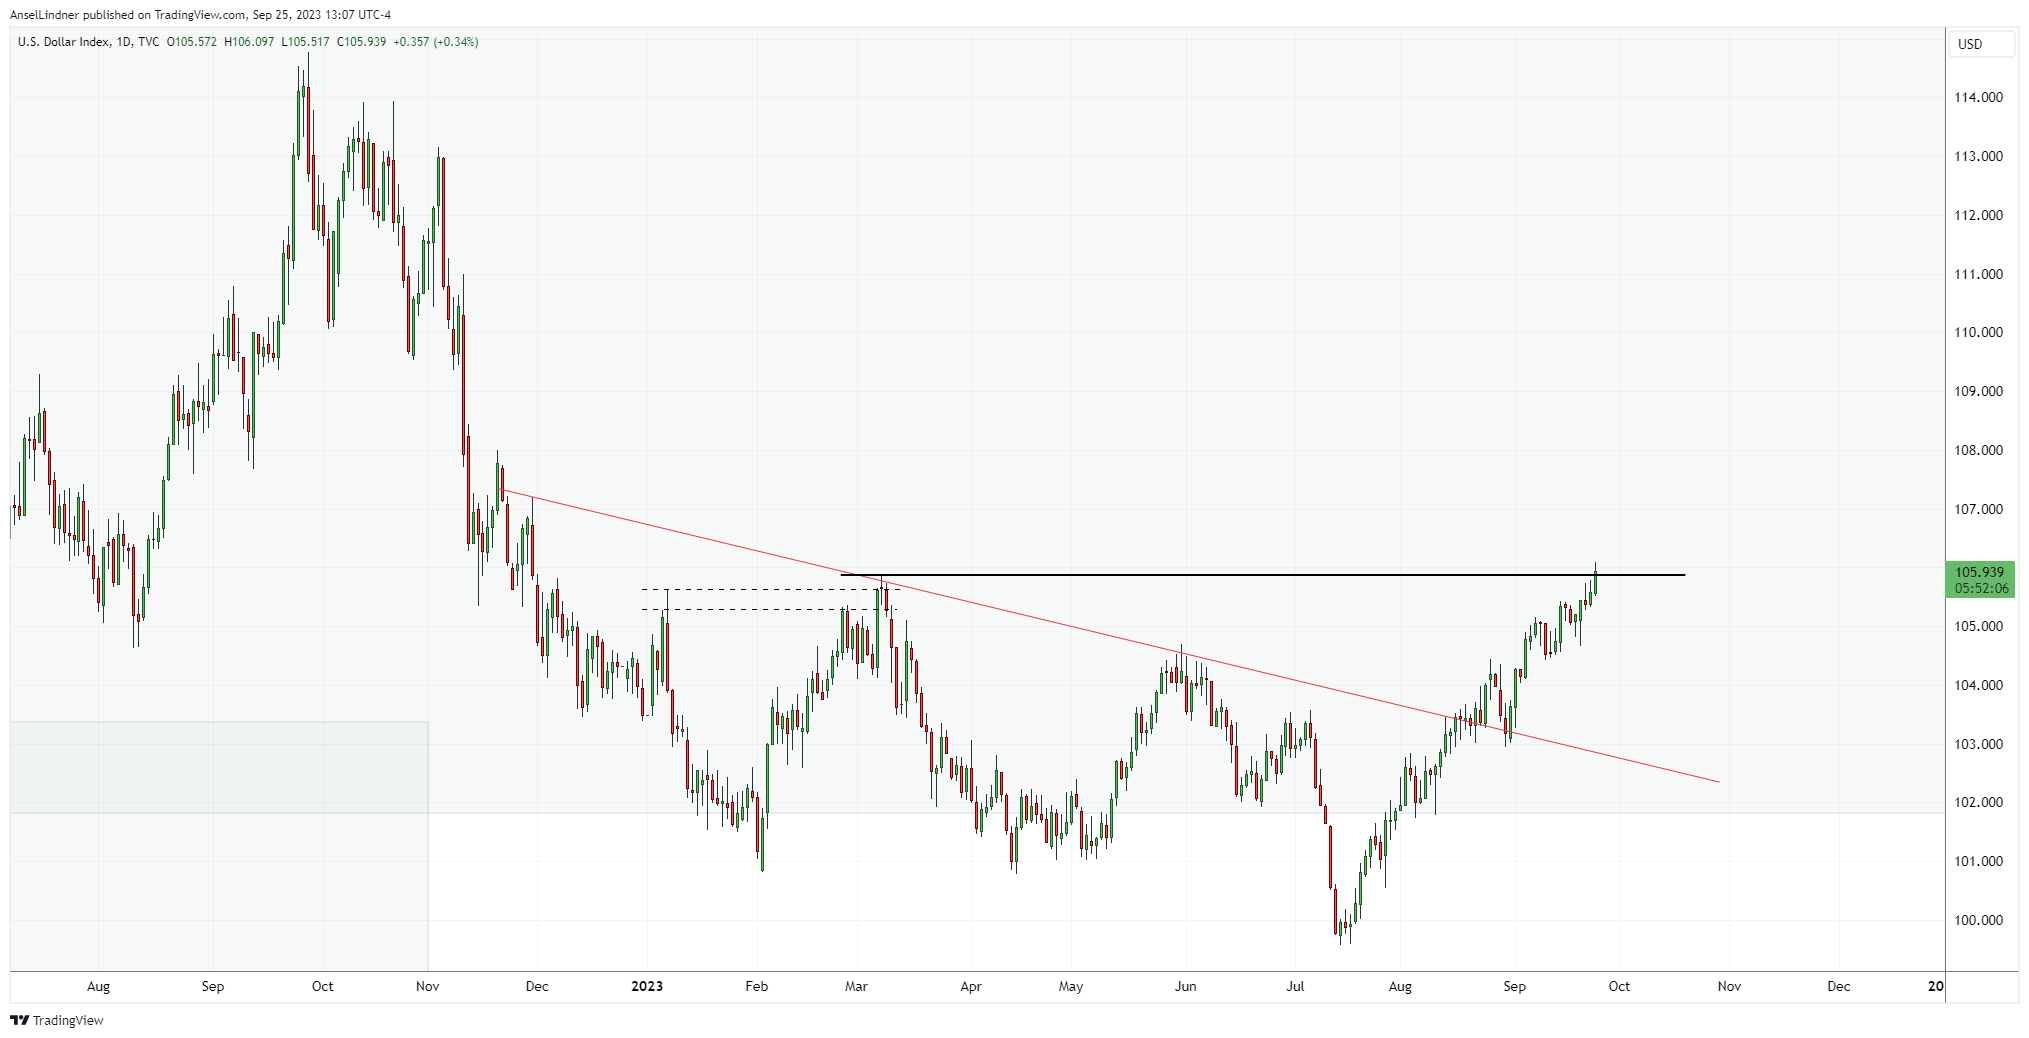
The macroeconomic landscape right now is one of a collective holding our breathe. The dollar continues to creep higher, $DXY at 106 this morning. Oil seems to be defying gravity as well, hitting a high of $92 on the 19th. And most surprising to me is the US 10Y yield going higher, passing 4.52% as I write this. All these trends will rapidly reverse.
I have explanations for all of them. The dollar is being squeezed by international recession, forcing them to sell Treasuries, and the US buying oil to refill SPR ahead of 2024 election season when they'll dump it.
More on these topics on this week's BM Pro post coming out Friday!
- The FOMC Nothing Burger
The FOMC met last week and paused rate cuts again. They paused at the June meeting, and then raised at the July meeting. The dot plot and the Fed Funds Futures (FFF) are very similar, at most predicting one more rate hike this year and then turning to rate cuts next year.
Fed Funds Futures are pricing in a 78% chance of a continued pause at the next meeting. No move is more likely than a pause until probabilities switch to a cut in July 2024.
It is likely the next recession coincides with a financial crisis, like a liquidity freeze, causing the Fed to cut by whole percentage points. Powell, has proved to be a slow and deliberate Fed Chair, who has had some insight into the market. For instance, 2019, Powell sympathetically cut 3 times before the Repo Rumble in September of that year. I expect him to do the same again. He will correctly foresee the recession, and the new Treasury buy-back program might work to mitigate the worst effects of a crisis. However, there will be a point at which all their programs will not be enough, and the Fed will be forced to cut rapidly. That could be the later half of 2024.
- Federal Reserves Reverse Repo Facility is crashing
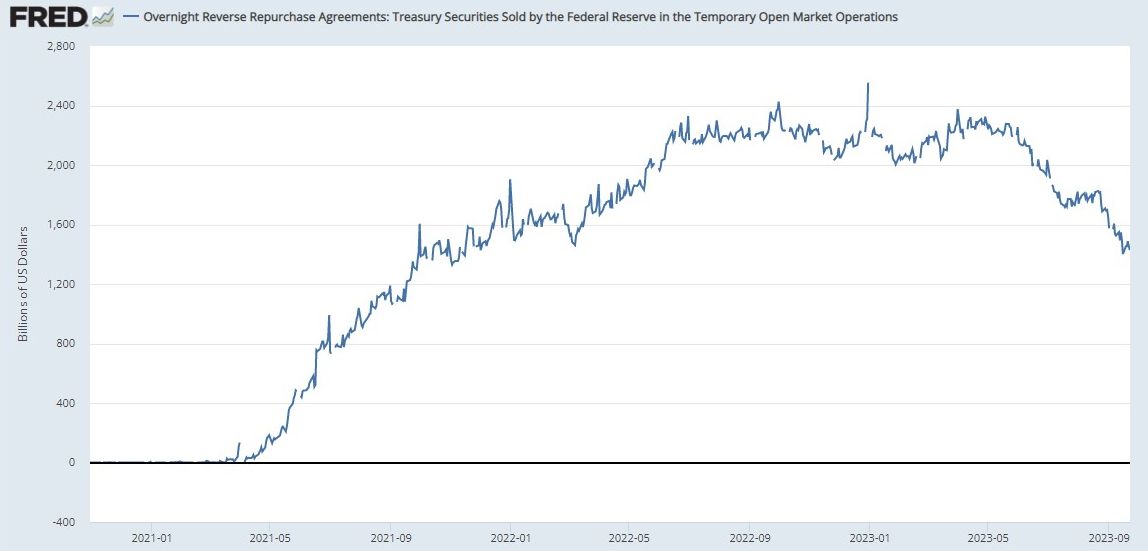
This is something that has flown under the radar, being overshadowed by Fed balance sheet tracking. The Reverse Repo Facility (RRF) represents the collateral shortage vs a money shortage in the economy. When there is ample money/deposits and not ample collateral to move that money around (remember, money moves with collateral lubricant), the mismatch forces dollars into the RRP with the Fed. The Fed takes the money and lends its collateral from its balance sheet of government securities out to the banks.
Liquidity comes from two sources in the modern system, collateral and cash. You must have both. When there is liquidity in cash but not in collateral, banks would normally be able to go to the private Eurodollar financial system and do this kind of reverse repo. But when that system breaks down as it has right now, the Fed becomes lender of last resort.
The dropping of this balance could mean that collateral is becoming more liquid in the financial system, or that the liquidity premium enjoyed by cash is going away and cash is becoming more tight.
I discussed this development on Friday's live stream.
It seems the strategy being dreamed up here is to prevent a bidless off-the-run (OFR) Treasury market, while at the same time doing a sort of operation twist to more liquidy on-the-run (OTR) securities. It is not a pure money printing scheme, and will likely be successful in mediating a similar panic to the ones experienced in 2009, 2019 and 2020. The inflationary impact of this policy is unclear, but I tend to believe the effect of stigma is always underestimated. For example, if the Treasury is forced to do this kind of program, they are signaling the economy is in dire straights.
But Central Bankers are always fighting the last war. The next time could evolve slightly differently. For example, this program could cause stigma for all OFR securities prematurely creating havoc, not just for repo and funding, but for banks balance sheets in general.
Bottom line, if the economy was functioning well, we wouldn't need these types of programs.
Price Analysis
Join the Professional tier to receive my MARKET PROTONS, short price analysis and actionable forecast updates on Bitcoin and macroeconomic factors! Sign up today!
Bitcoin Charts
The price has returned to the extremely boring $26k area.
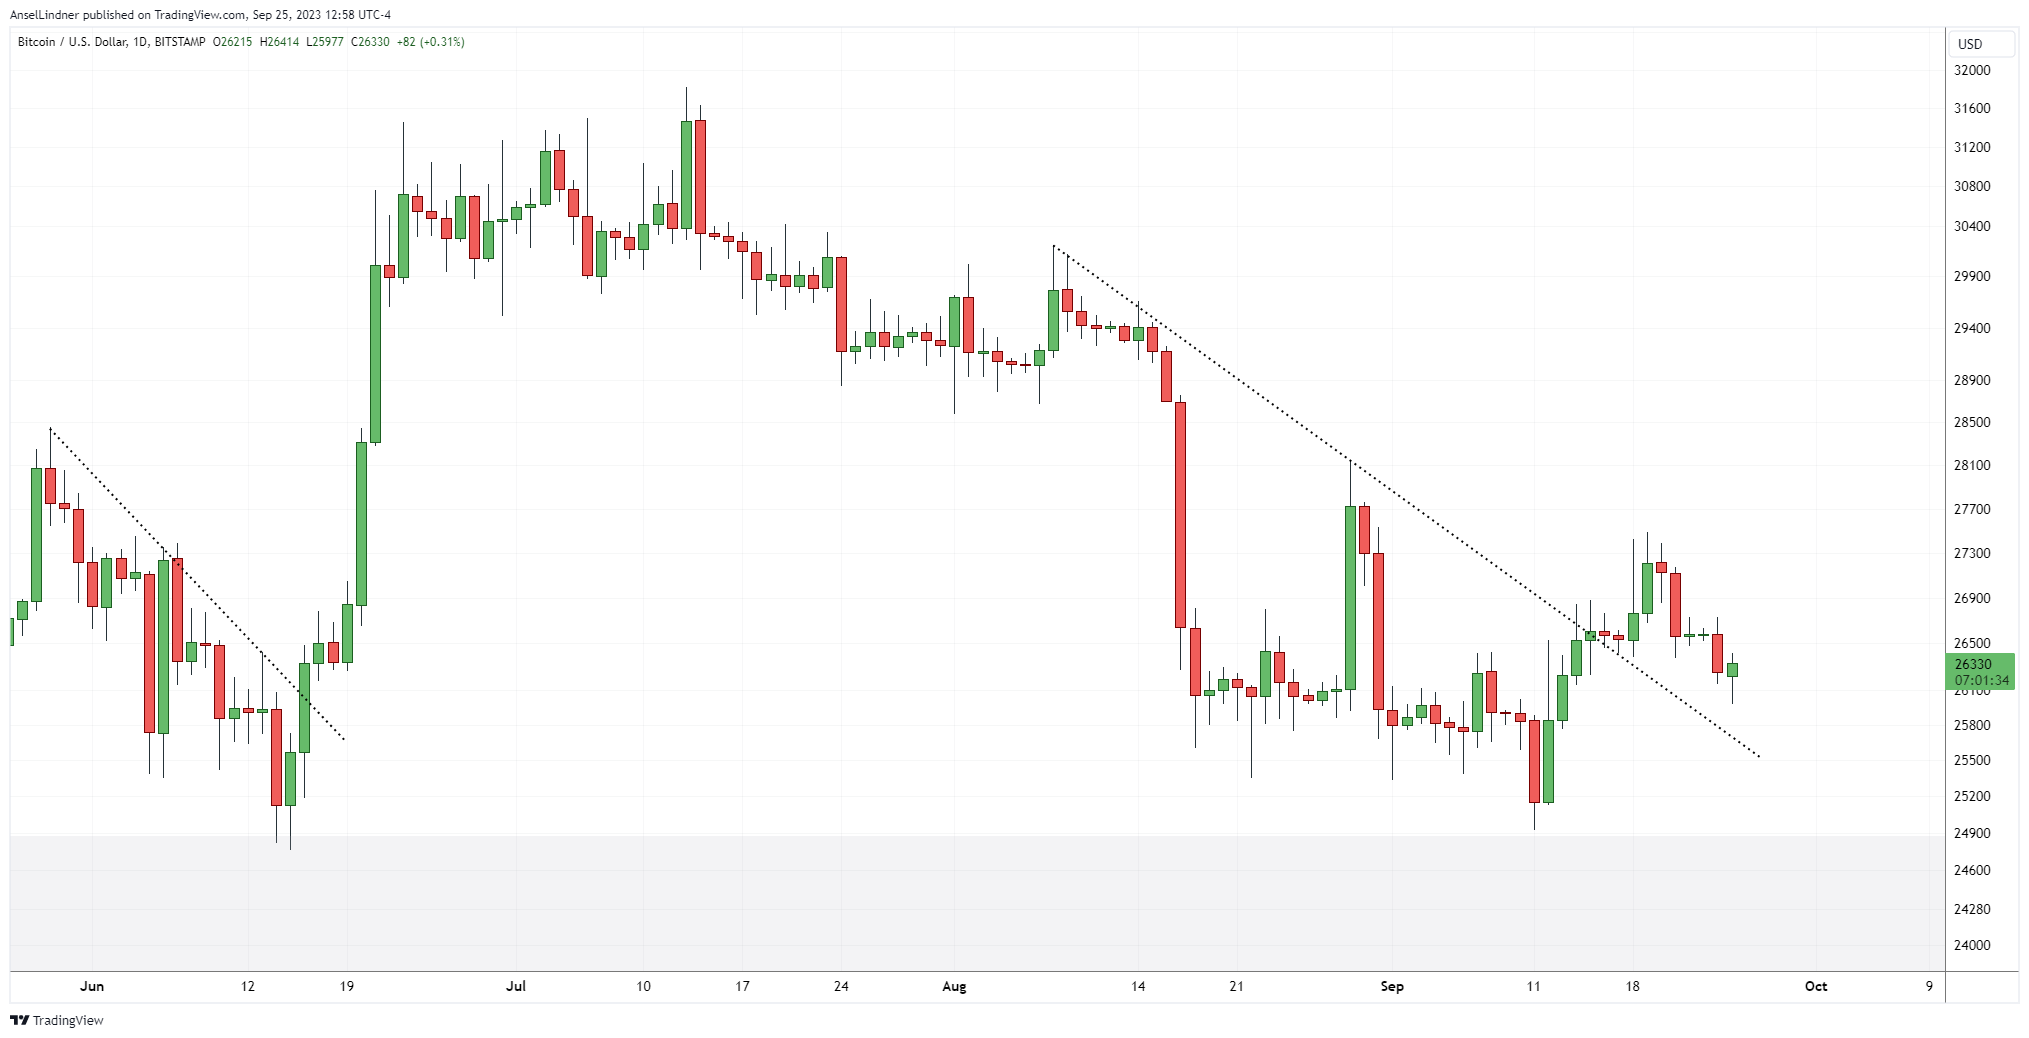
But it has been able to show some strength as the stock market has absolutely tanked in the last week. The S&P 500 is down 4% from its recent high, while bitcoin is only down 3%.
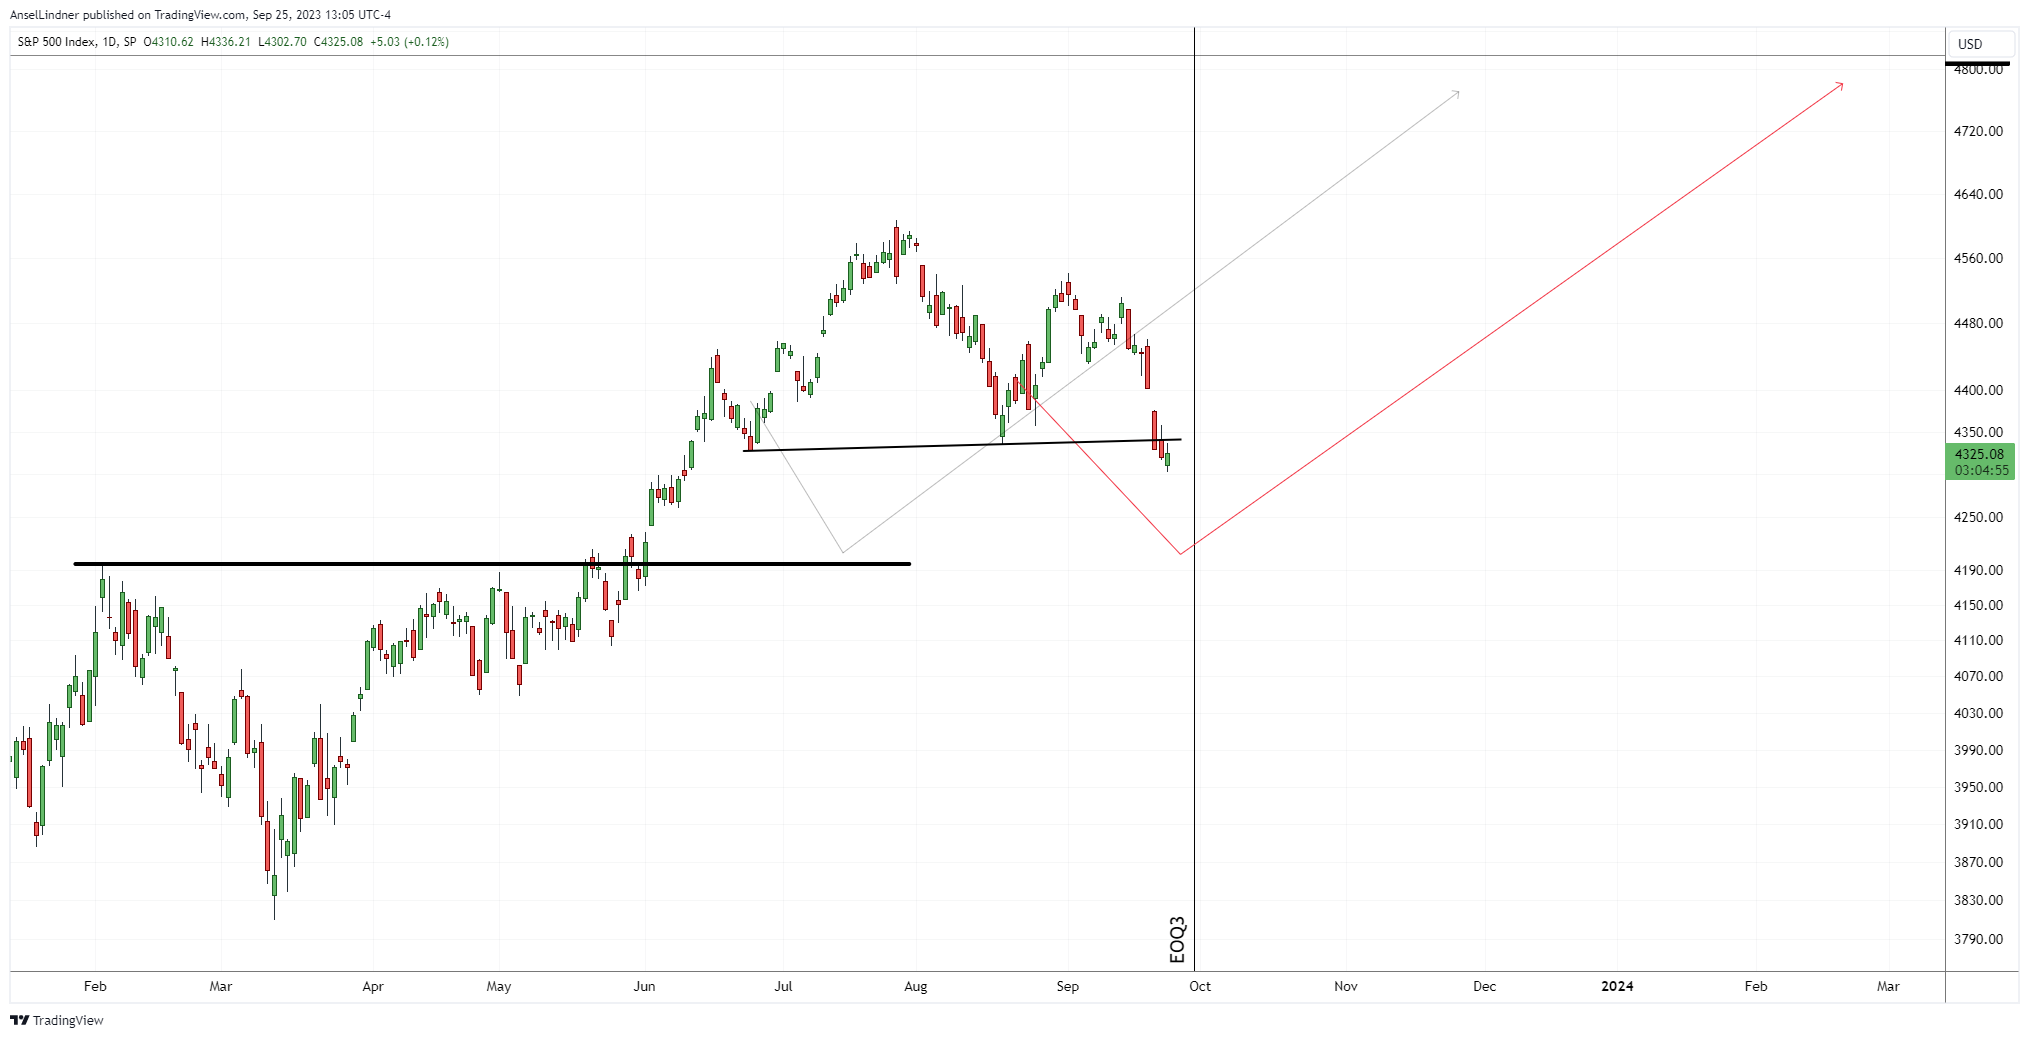
I drew the above gray arrow expecting a bear trap dip earlier in the year. Then I updated it to the red arrow, expecting a similar dip into the end of quarter 3. That seems to be what we are getting now.
The dollar is also breaking out right now to new yearly highs. To carry on the discussion from above in the Macro headlines section, the collateral shortage is transitioning into a cash shortage.
I also pointed out last week on BM Pro that at the start of bull markets, the correlation coefficient for DXY and Bitcoin tends to switch positive. That means they both rise together at the beginning of the bull run. It was only during the COVID era that this relationship broke down a bit.
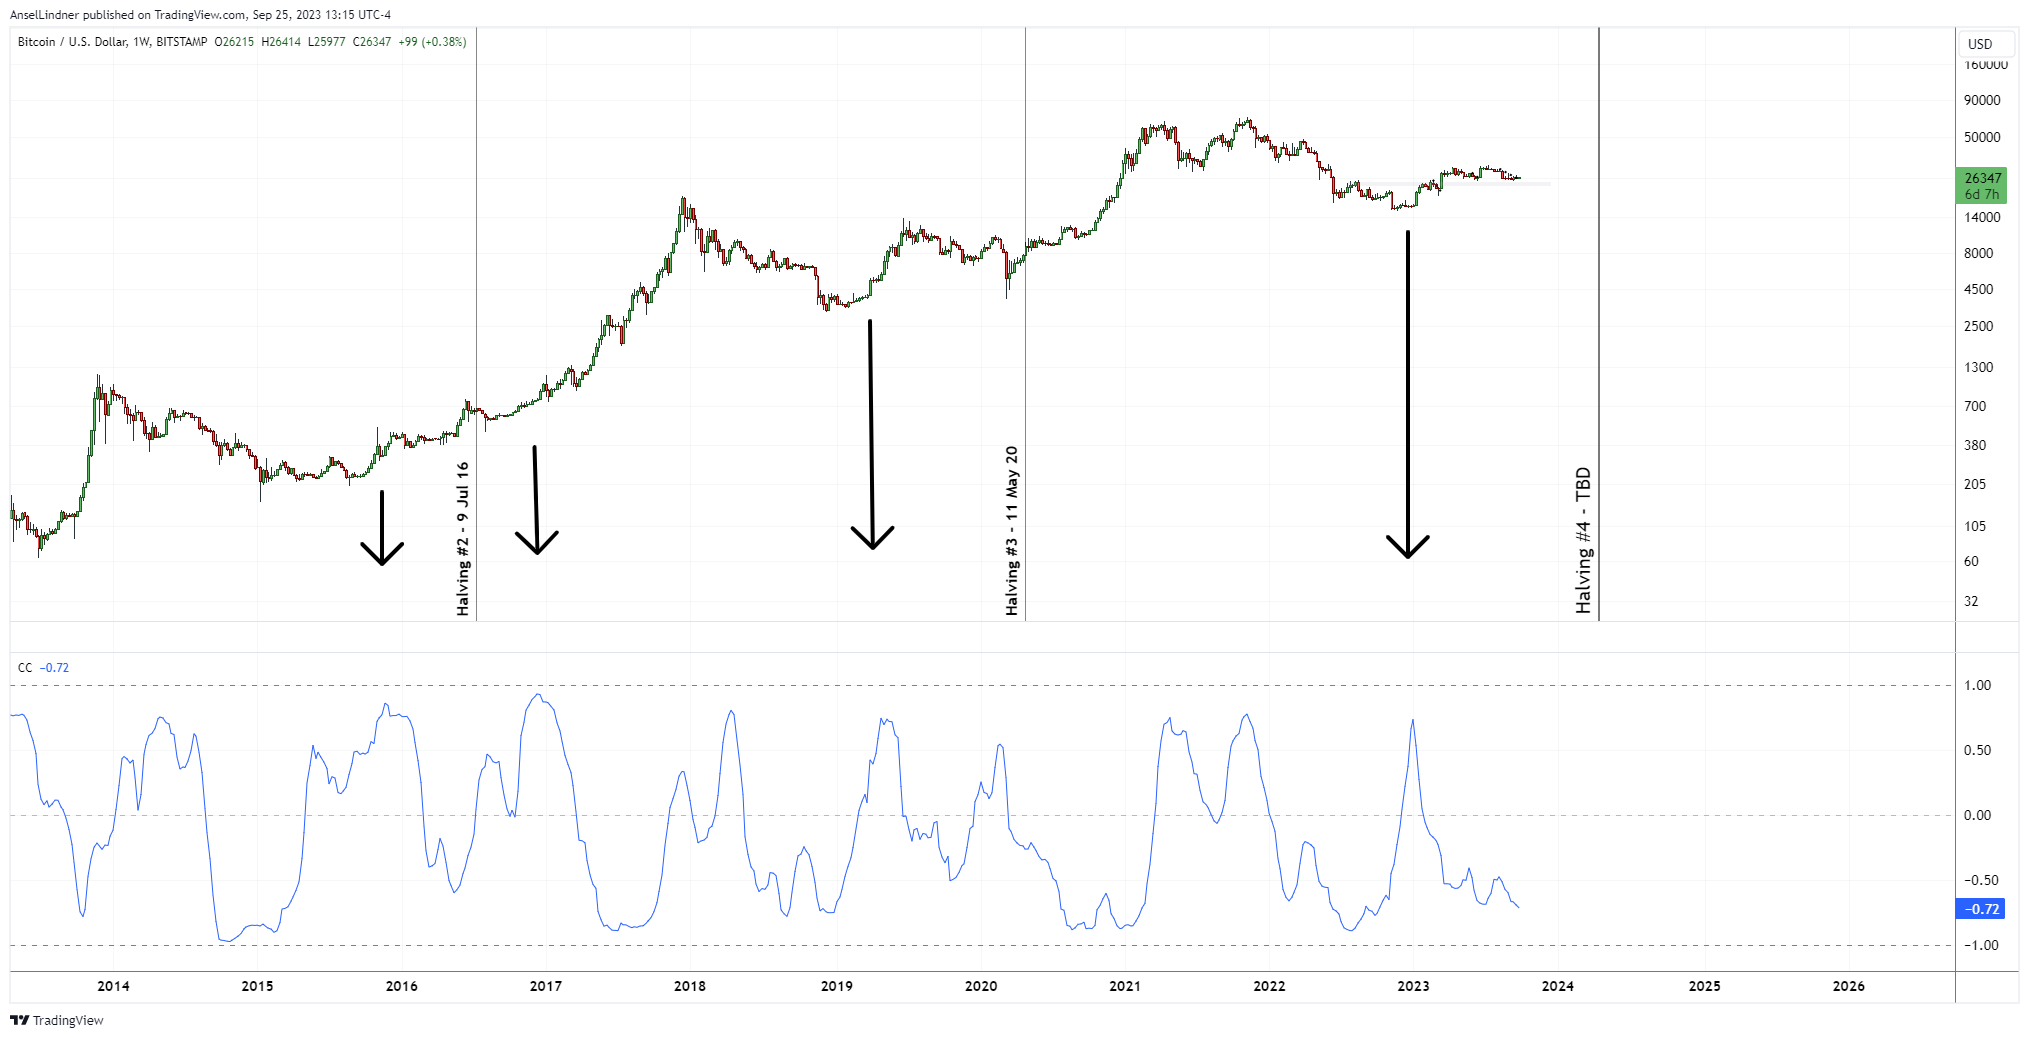
Right now the dollar and bitcoin are indirectly correlated as you can see above. However, what I'm trying to show is that if the dollar strengthens that doesn't mean bitcoin must fall for certain.
I still believe the likelihood of a significant green weekly candle is higher than normal, but I do not expect us to break right through $31k. Downside risk is low IMO, so I will be aggressively buying any dips.
Get my short, medium and long term forecasts on Market Pro!
Mining
Headlines
Core Scientific has had a rough go of it last year. However, in the last two weeks we've see headlines that are positive for them. Last week, they finalized a deal with Celsius mining for a Texas facility and this week, they penned a deal with Bitmain for 27,000 miners.
Bitmain and Core Scientific have agreed on a combination of equity and cash to finance the purchase of new and more efficient bitcoin mining equipment. Separately, Bitmain has executed a new hosting agreement with Core Scientific to support Bitmain’s mining business.
A paper published by the Institute of Risk Management (IRM) concluded that Bitcoin has the potential to be a catalyst for a global energy transition.
According to the report, Bitcoin mining can reduce global emissions by up to 8% by 2030. This can be done by converting the world’s wasted methane emissions into less harmful emissions. The report cited a theoretical case saying that using captured methane to power Bitcoin mining operations can reduce the amount of methane vented into the atmosphere.
Difficulty and Hash Rate
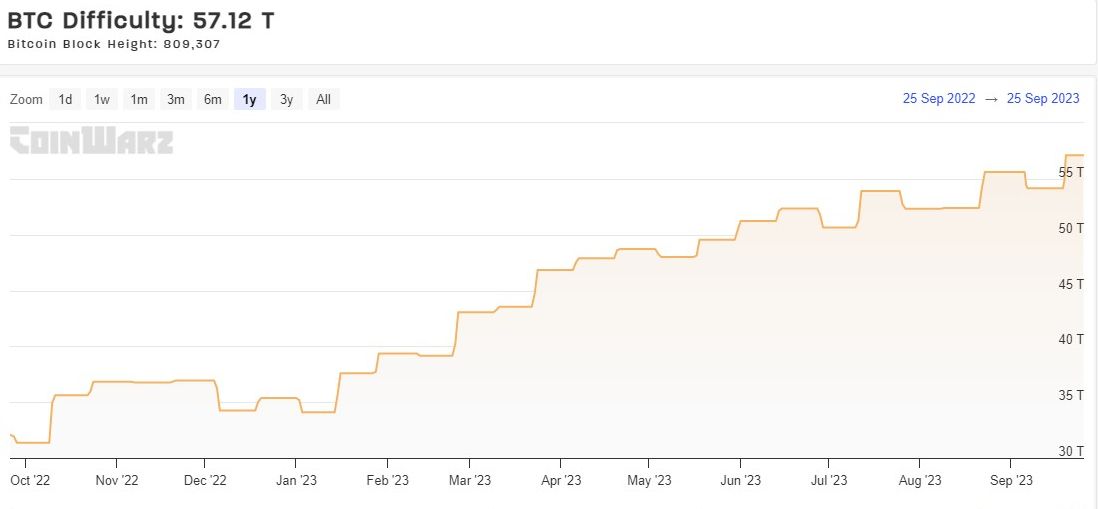
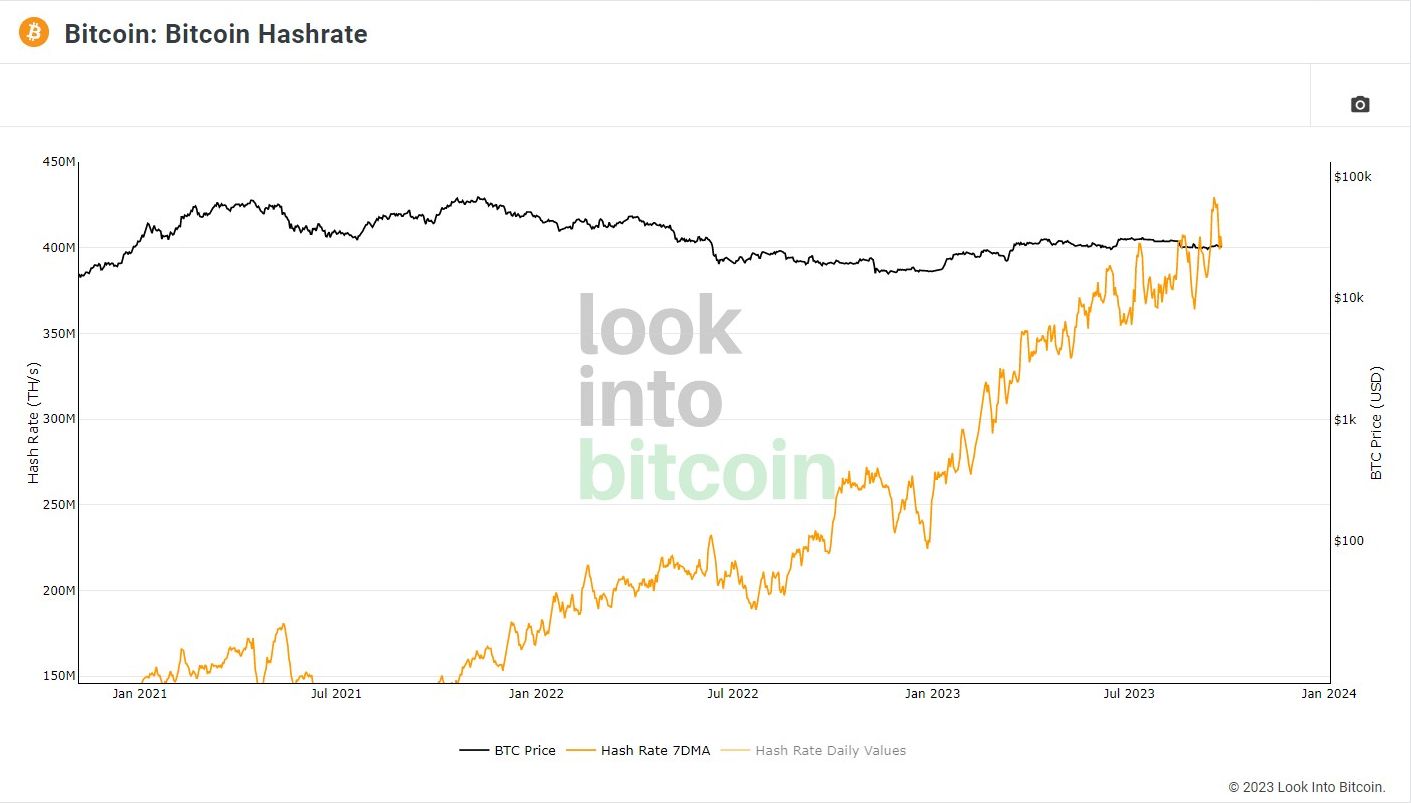
No change to Bitcoin's difficulty this week. It is estimated to adjust up by over 5.5% in 17 hours from the time of writing. This is another HUGE turnaround from last week when hash rate was lower and on track for a -5% adjustment.
Hash rate
Bitcoin's hash rate also flew to a new ATH this week.
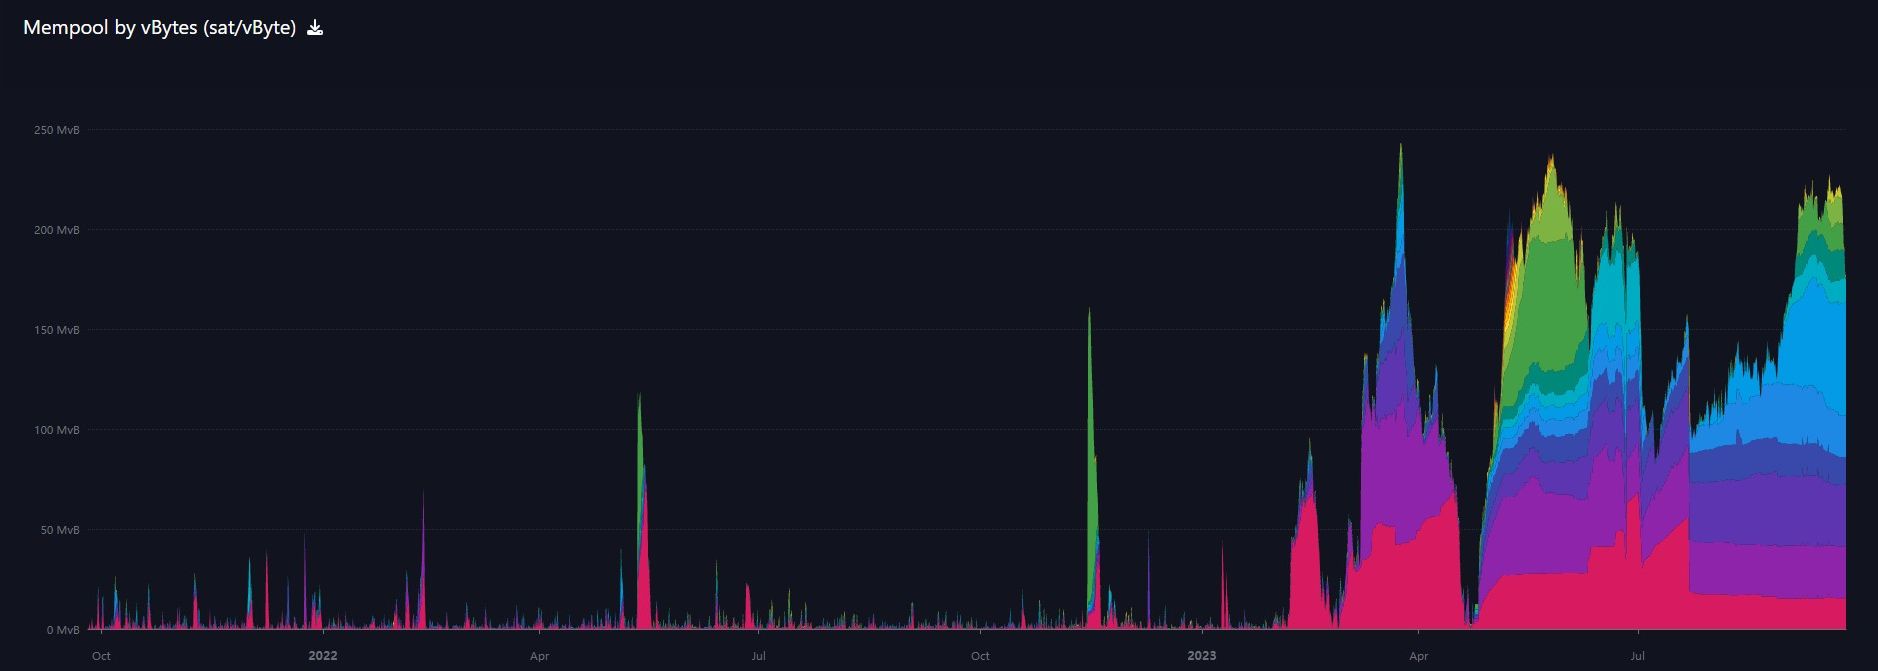
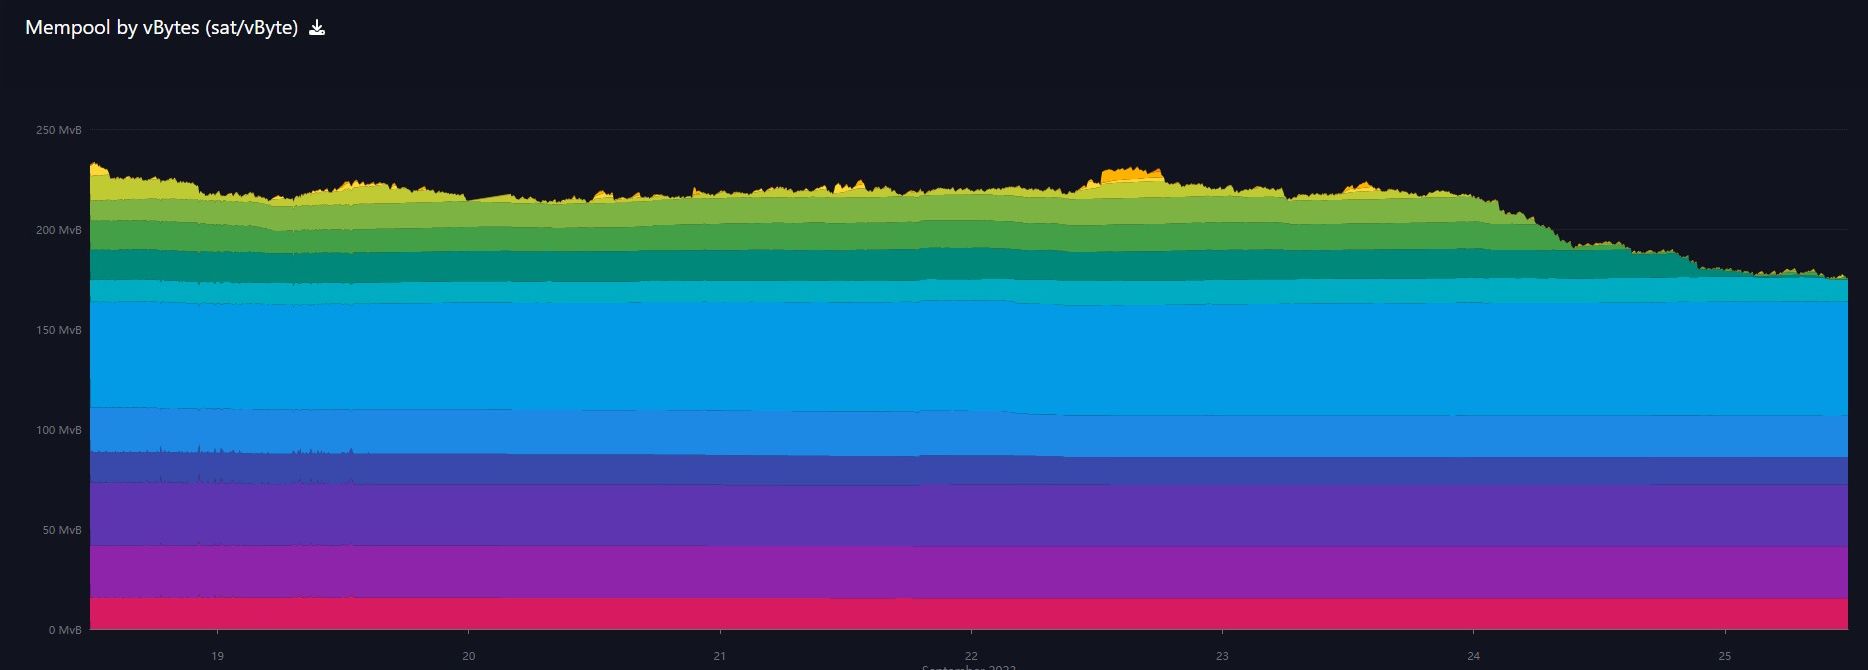
Mempool
The mempool has dramatically shrunk in the last 12 hours. It is hard to see on the yearly chart, but the 1 week chart you can clearly see the transactions getting chewed through. It is down from 225 MB to 175 MB this week.
That's it for this week. See you again next Monday!!!
A
- Were you forwarded this newsletter? You can subscribe here.
- If you liked this newsletter please SHARE with others who might like it!
- Podcast links and socials on our Info Page.
- More ways to support our content, some don't cost a thing!
DONATE directly on Strike or Cash App to support my work! You make my content possible! Thank you.


Disclaimer: The content of Bitcoin & Markets shall not be construed as tax, legal or financial advice. Do you own research.
* Price change since last report
** According to mempool.space