Macro Chart Rundown - 6 Oct 2021
In this post I go over the emerging energy crisis in detail, comparing European prices to US prices and the state of production. Then I discuss the dollar and gold.

If you like this content, SUBSCIBE and SHARE! Thank you.
In this post:
- Oil and natural gas - energy crisis in charts
- Dollar
- Gold
Energy
Boy, do we have some action in the energy sector. Natural gas has exploded higher.
Europe Nat Gas Prices
In the last 10 days, we've seen some major gaps to the upside on the price, which has gone vertical. It is very dangerous to trade this chart because it could double again with a couple days, or could reverse from right here. The thing to remember is people need natural gas but cannot afford to buy it at all cost. The money that they spend on natural gas at these insane levels won't be spent elsewhere! That sends a whole host of second and third order ripples through supply chains once again. What a mess.
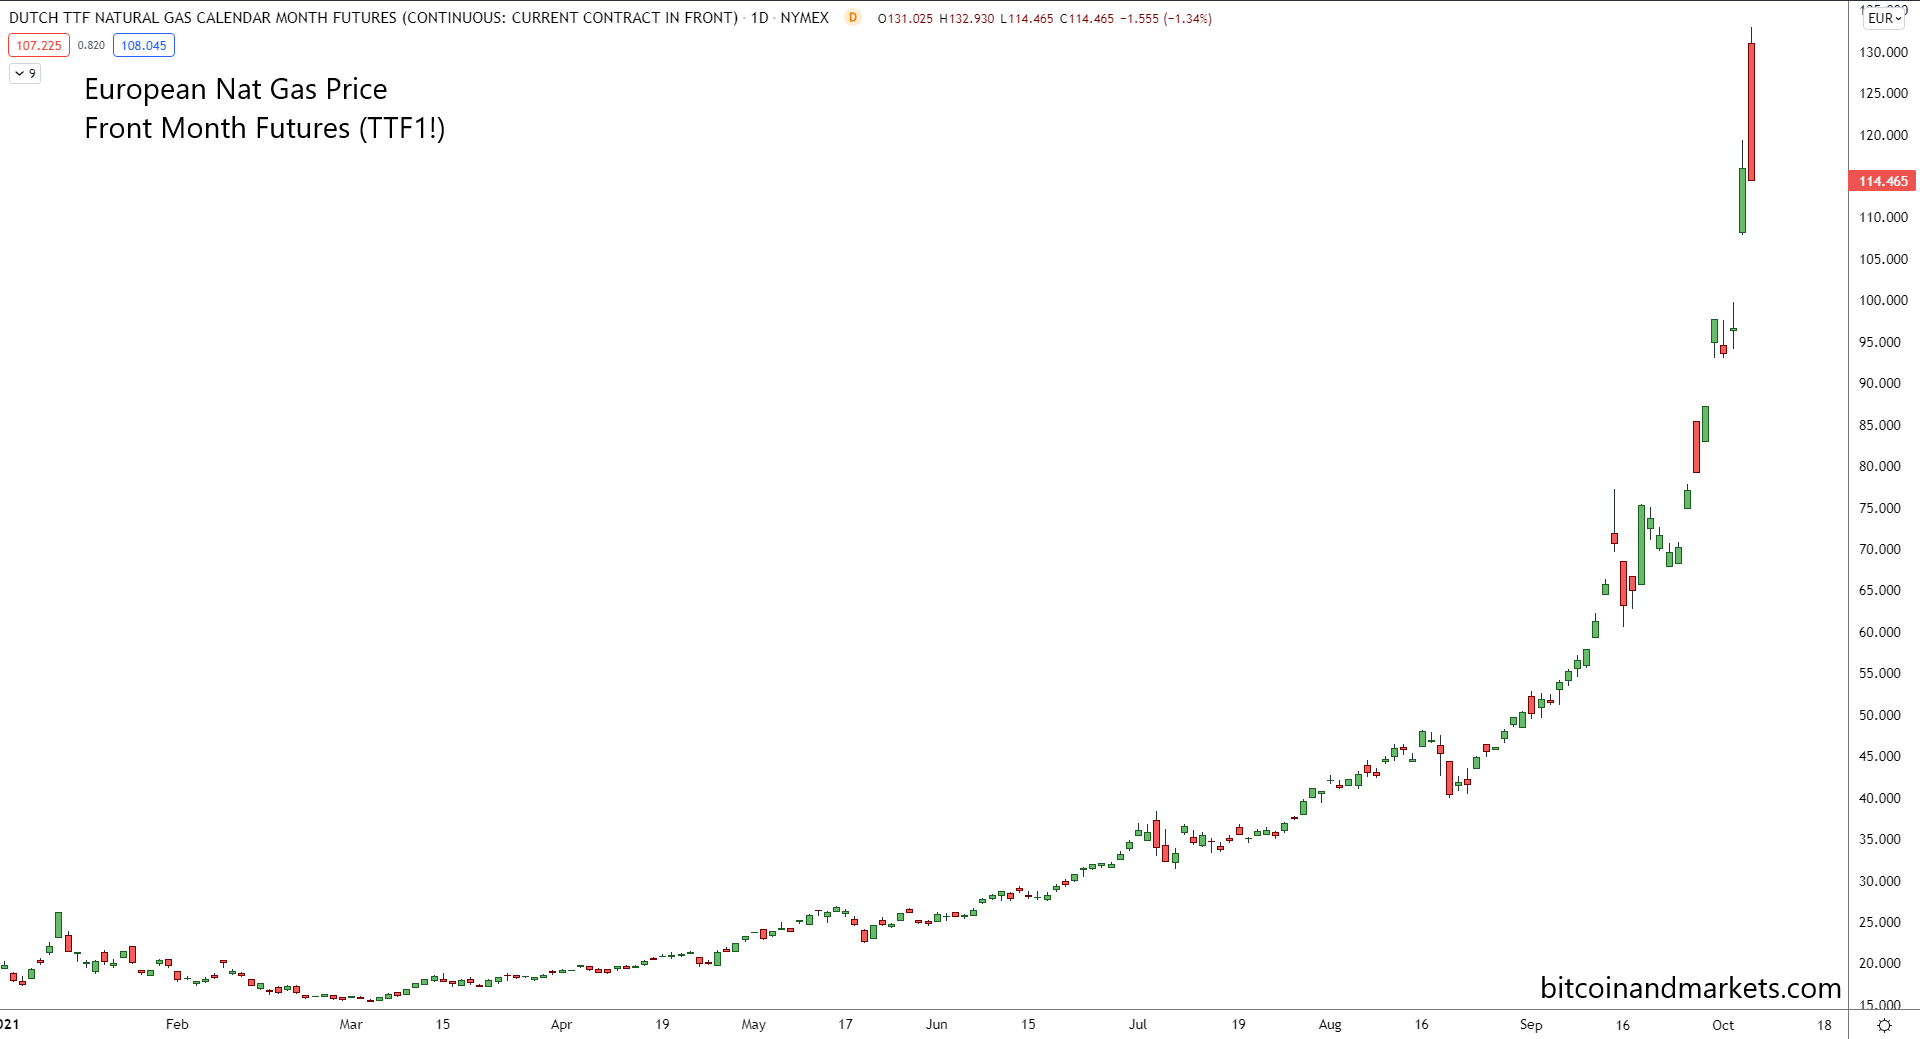
The price will come back down guaranteed, but when that will be is the hard part to predict. It will take a year or two, but prices will get back to €20 again.
It's so important I'll say it again - the money that is being spent on natural gas right now can't be spent where it was supposed to be spent, or where else it needs to be spent. The most directly affected industries from the resulting spending crunch will be many services like eating out and travel. Also personal savings will take a hit, along with confidence and lending numbers. That is a huge deflationary pressure. It could spiral out of control.
US Nat Gas Price
US price has not increased by nearly as much. There were some supply disruptions in the US for oil and gas recently due to Hurricane Ida, but should be back online now.
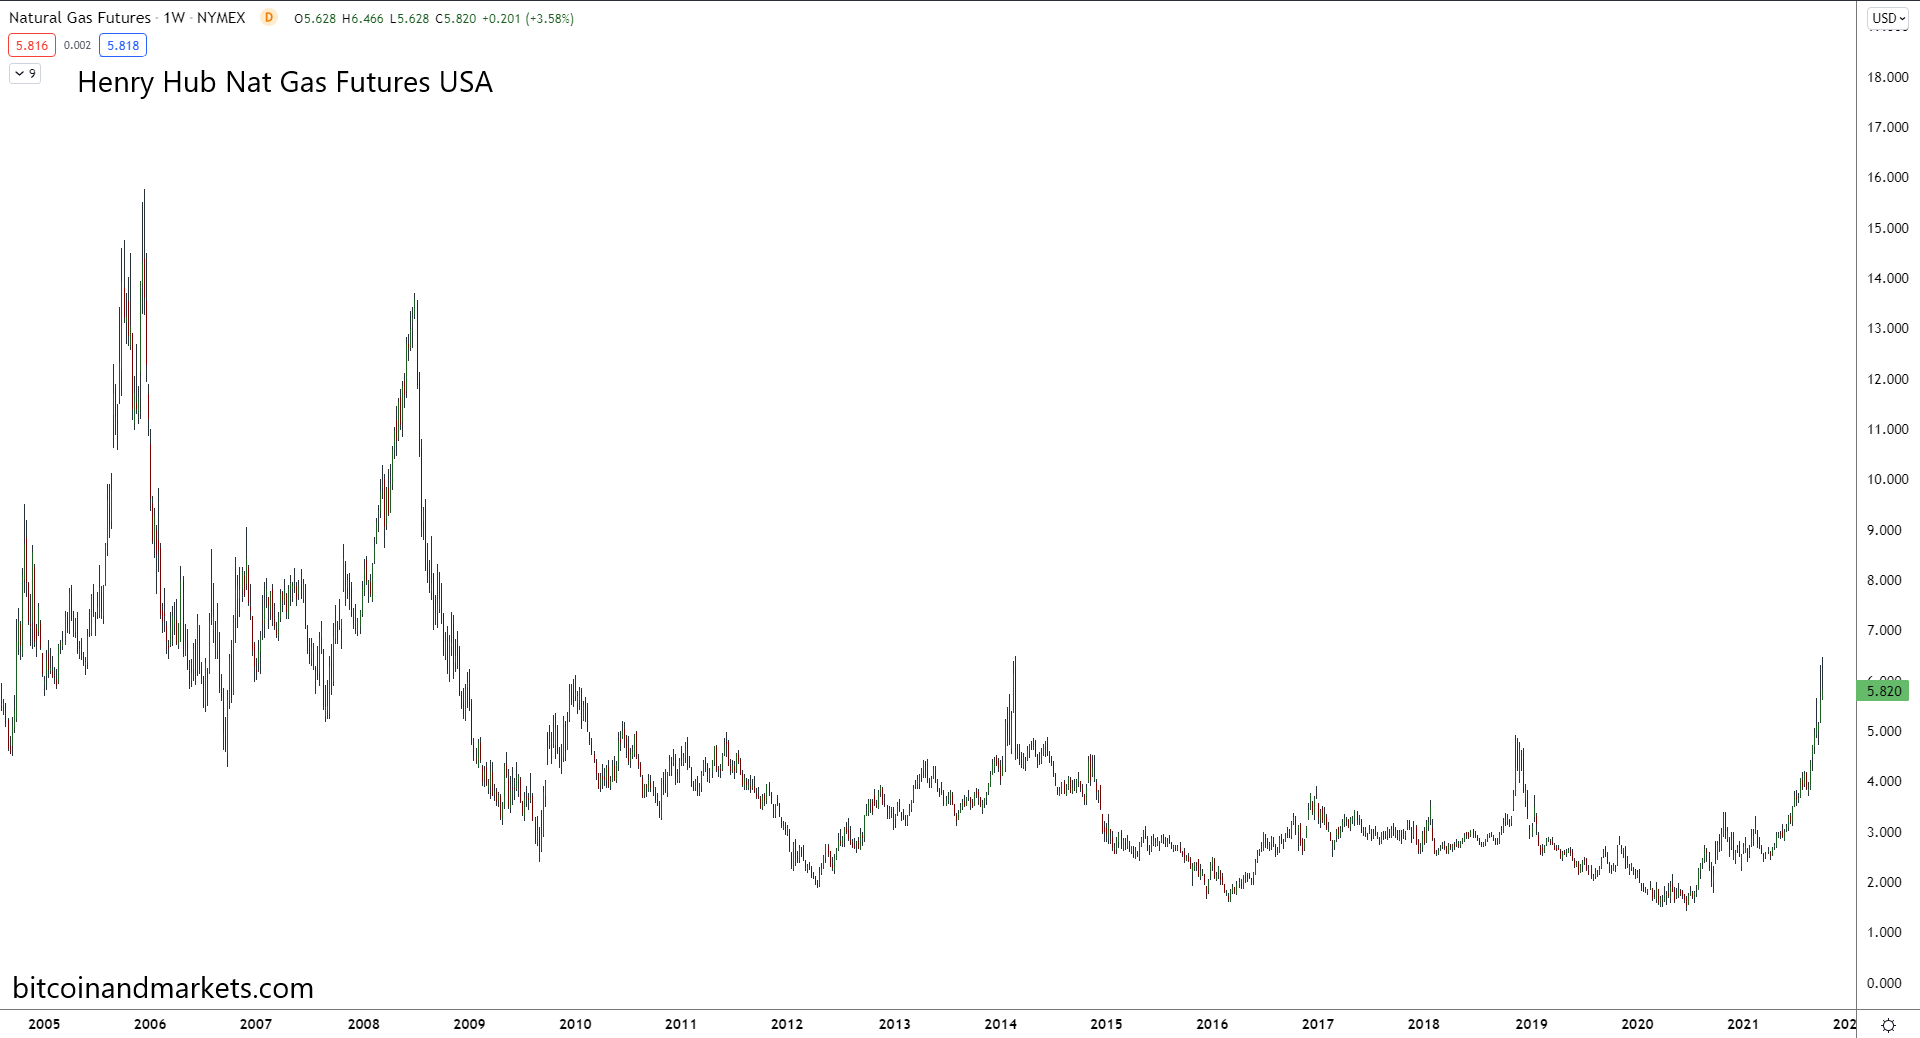
US natural gas prices can't help but go up in this environment, but the affect will probably be less than worried. The EIA put out their most recent update and forecast in September, "Steadily rising natural gas prices over the past year primarily reflects: growth in liquefied natural gas (LNG) exports, rising domestic natural gas consumption for sectors other than electric power, and relatively flat natural gas production."
It also noted that Ida took 90% of the Gulf of Mexico production offline, or about 2 billion cubic feet per day (bcf/d). They didn't expect it to fully recover until the end of September. That could very well be a primary cause for the supply disruption in Europe as US exports were affected.
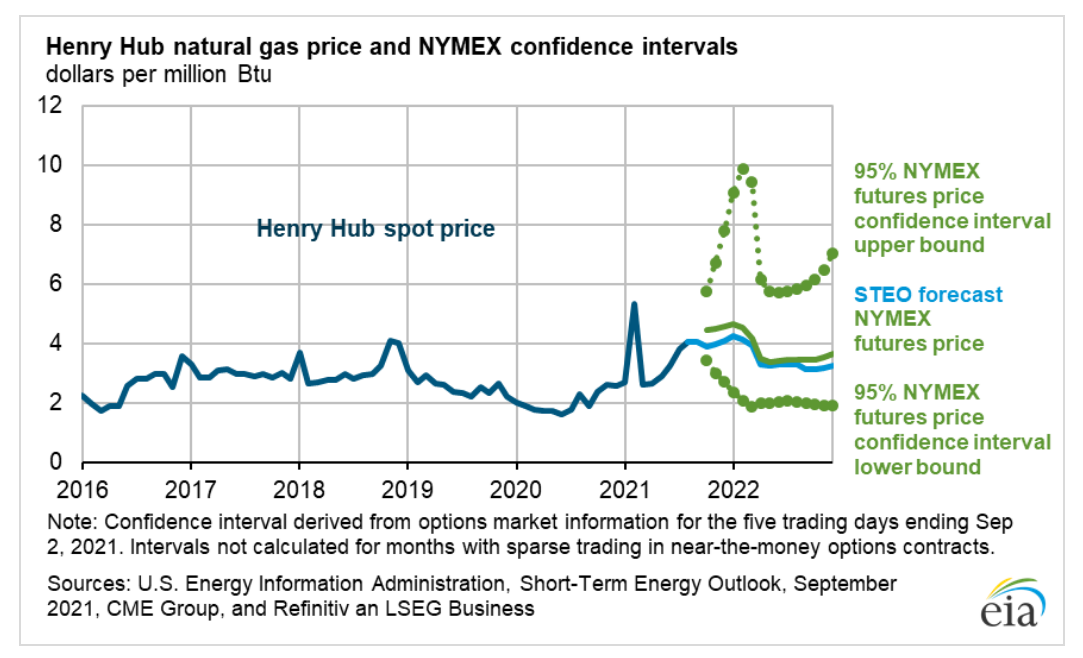
I expect US nat gas prices to follow the upper 95% confidence level on the above chart. $9-$10 nat gas is probable, then fall back to $5 very quickly.
Oil
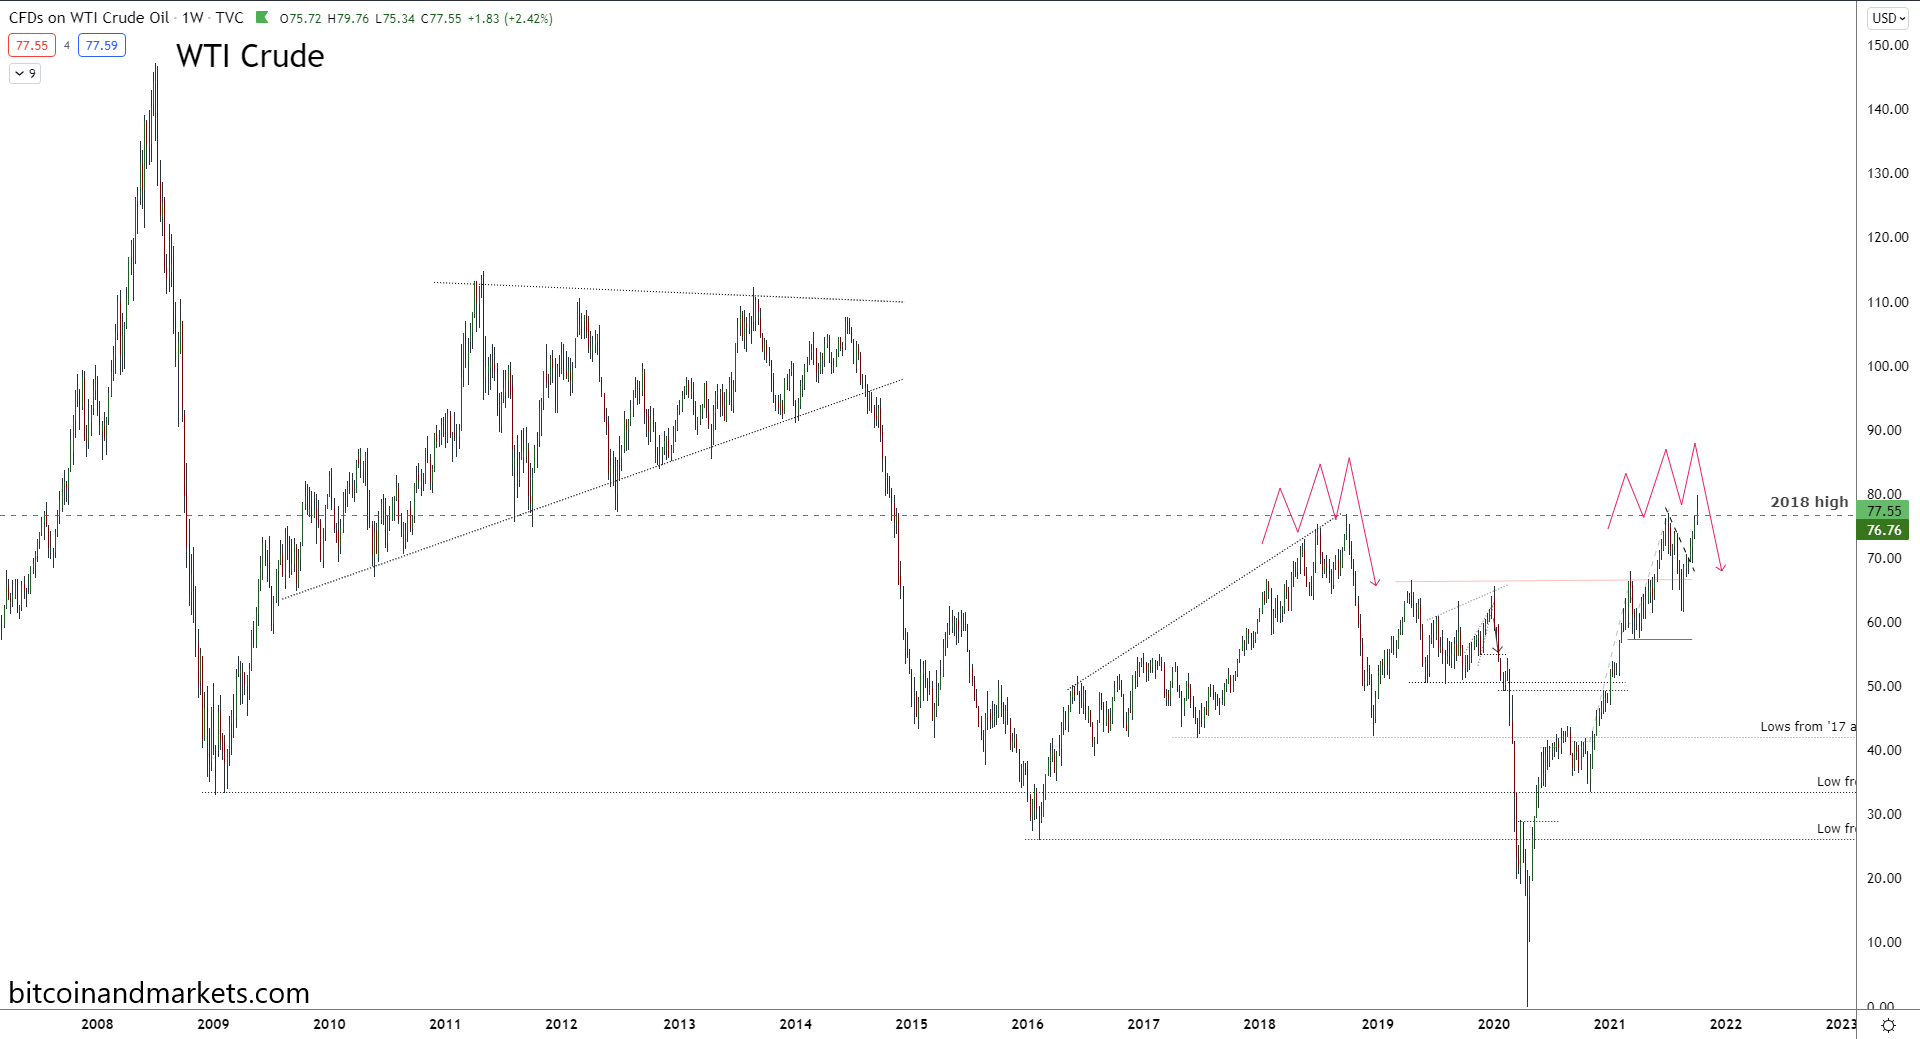
For oil, let's start with a long term chart. As you can see prices are not anywhere near historical levels. Even at $100/bbl it wouldn't break prices from 2014. $100 oil would cause extreme pain in the economy and certainly couldn't be sustained for the length of time it was from 2011-2014.
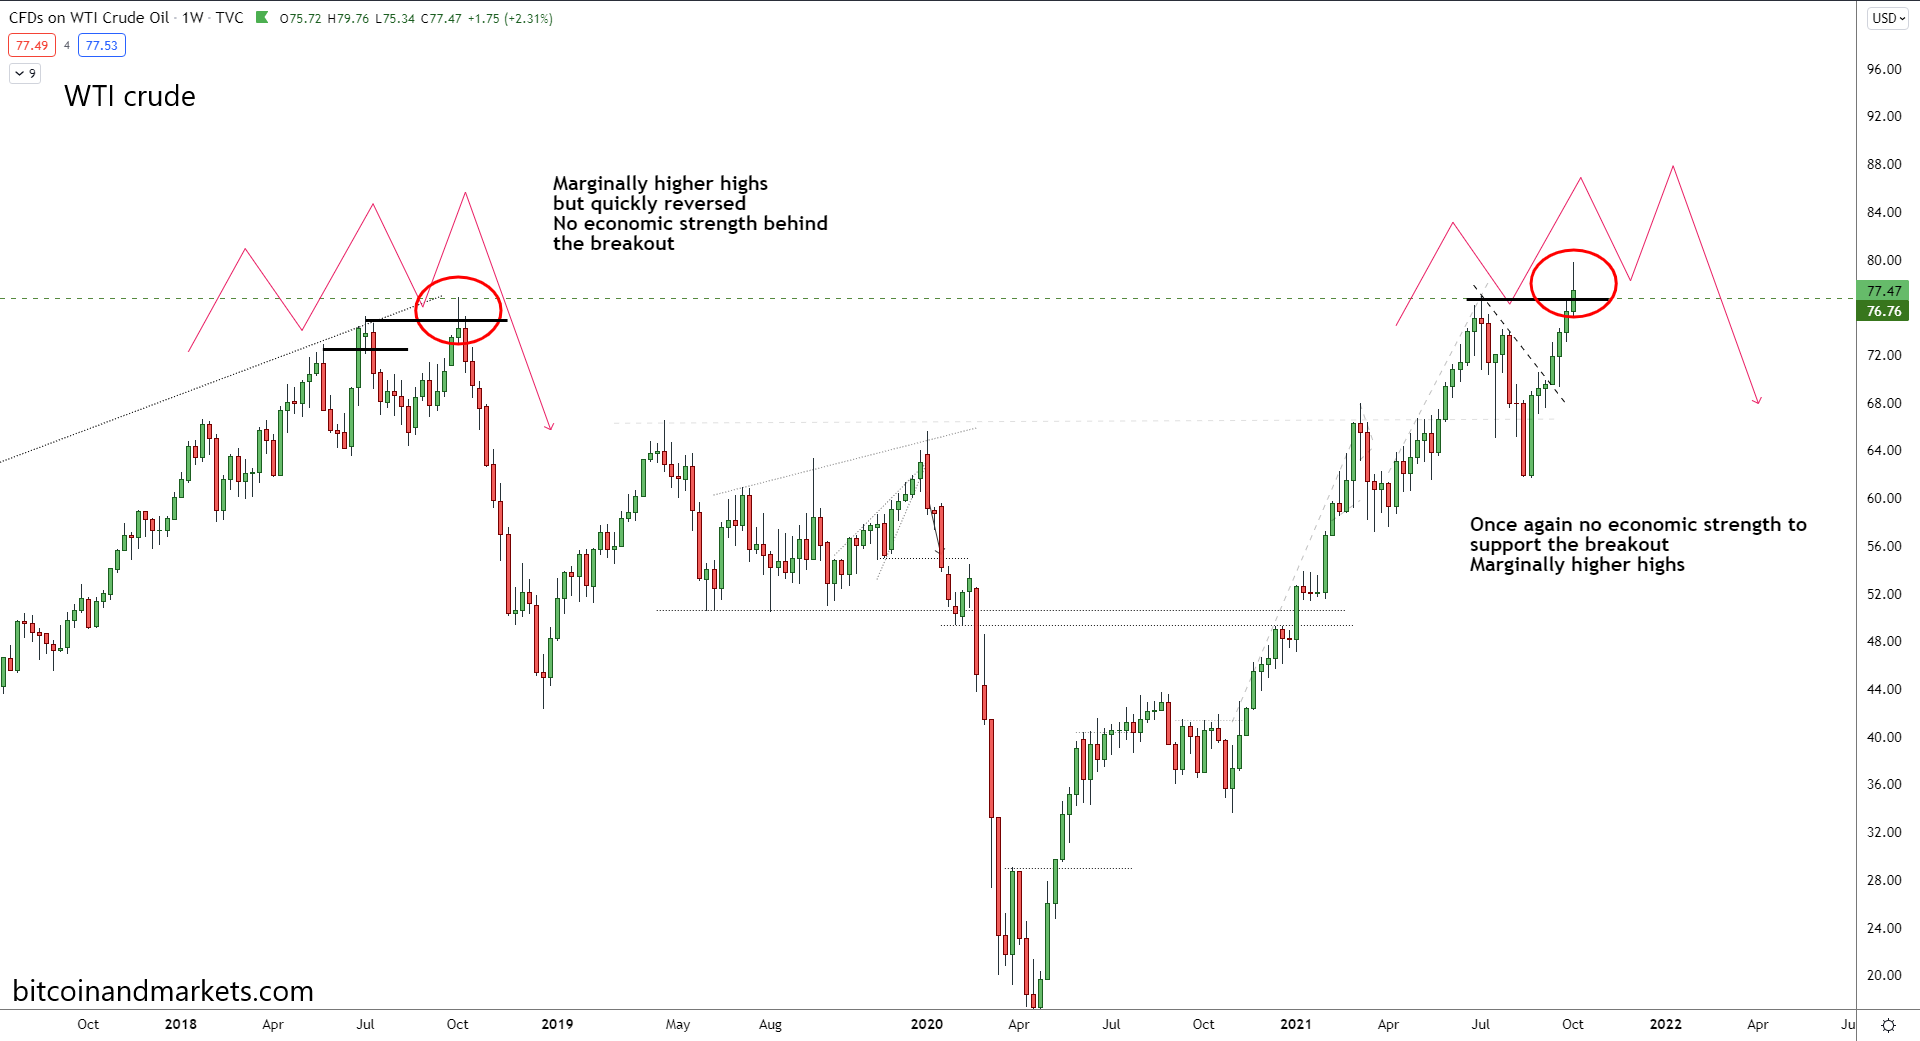
Zooming in we see that price has poked its head above the 2018 high in what I think is a fake out. There is simply zero economic strength anywhere in the world to support higher prices.
US oil production crashed 1.5 million bbl/d, due to affects of Hurricane Ida. The effect on supply was temporarily but prices often act like a whip, continue higher despite fundamentals cooling off. As you can see below, US production has rebounded already.
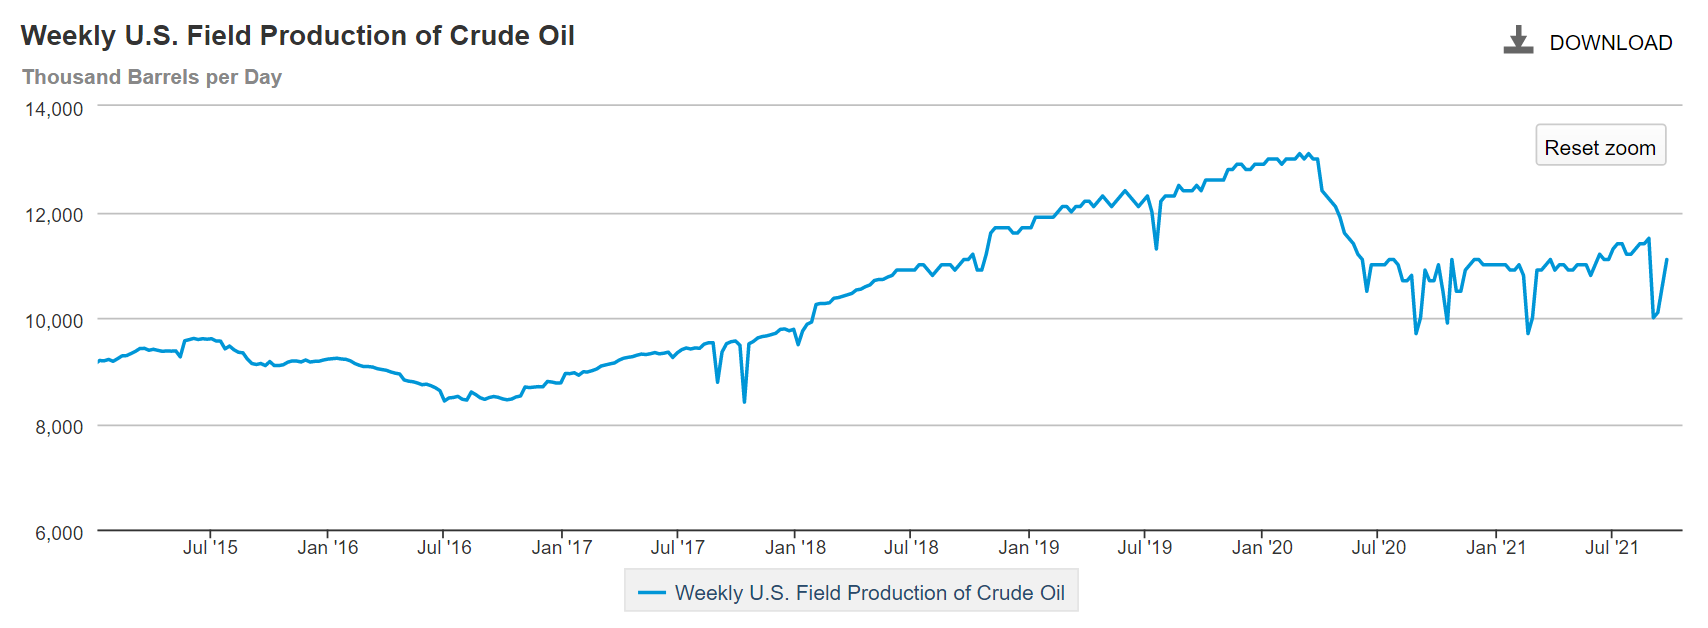
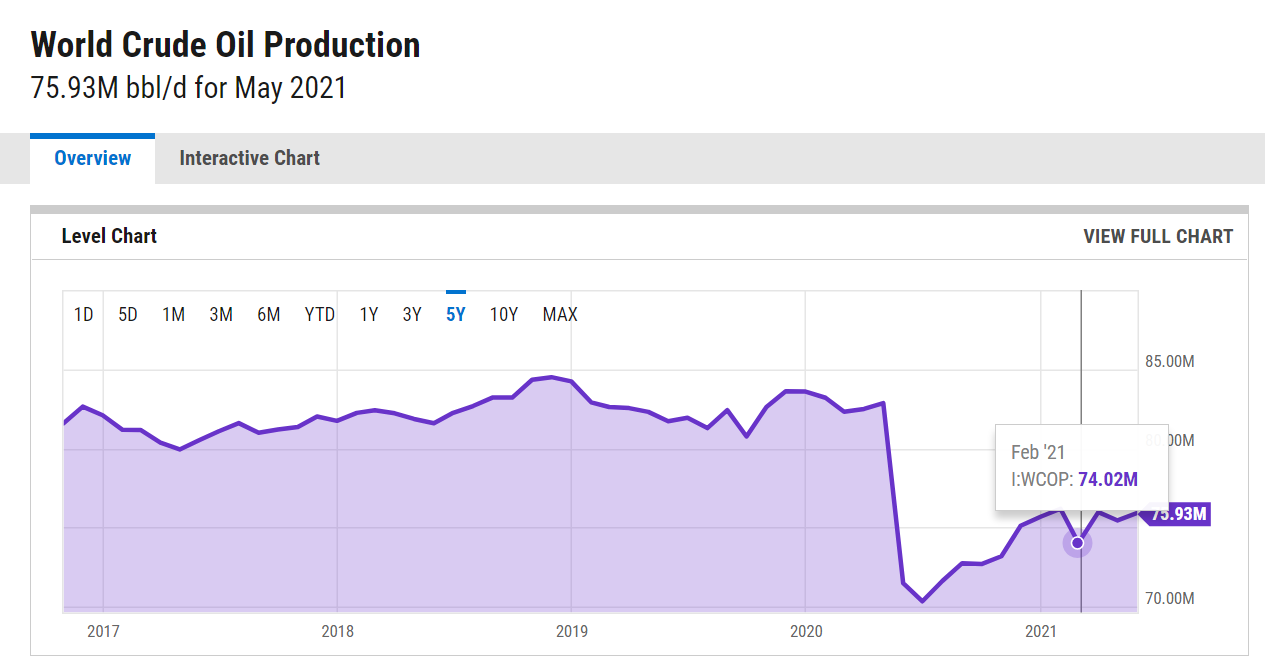
US production recovery post-2020 is outpacing the rest of the world. Global oil production has increased from 70.34 Mb/d at the depths of the corona crash to 75.93 Mb/d today, an 8% increase. US production has increased from 9.7 Mb/d to 11.5 at the end of August, a 18.5% increase.
All of US shale can now be produced profitably, with the average breakeven under $60/bbl. If the US returned to its pre-corona production levels, it would be producing 2 million more bbls / day, and selling into a slowing demand.
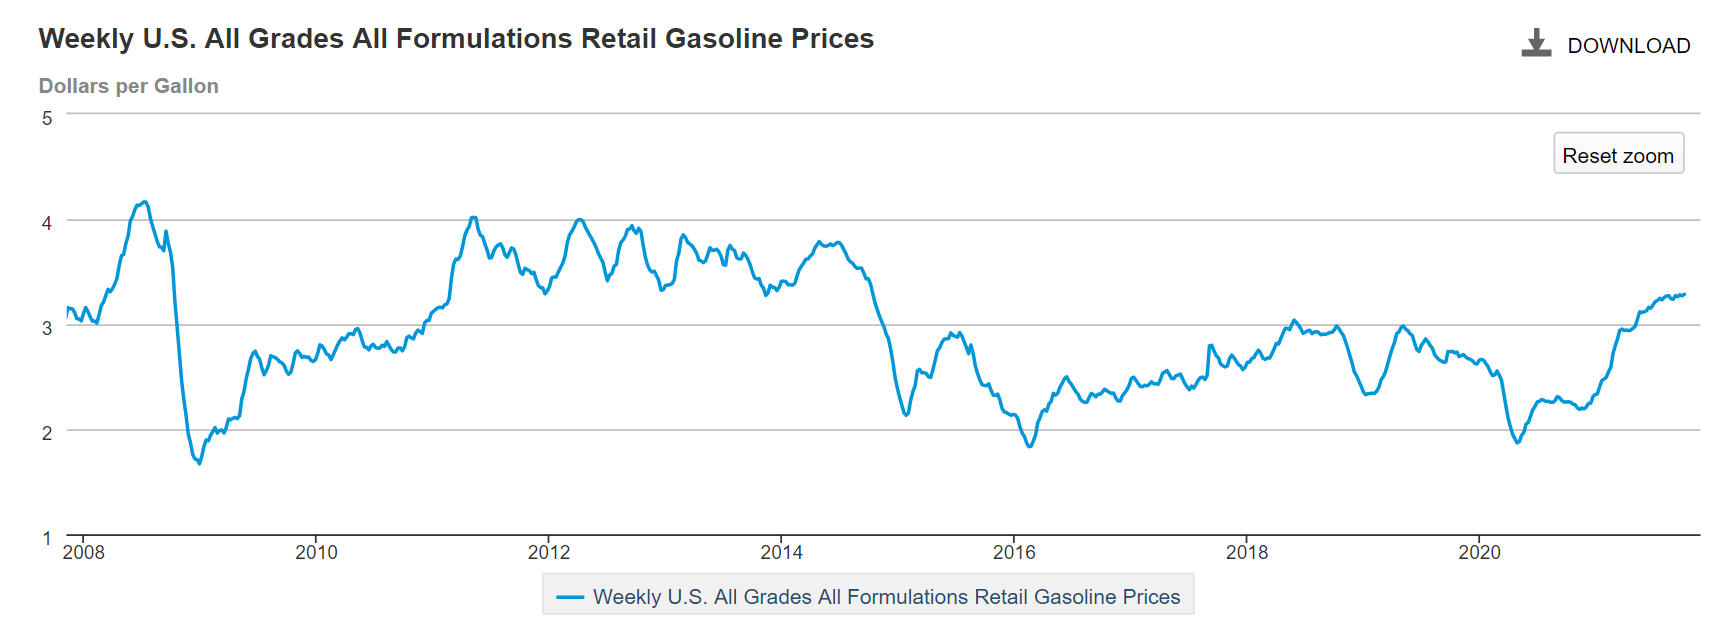
Gasoline prices
Gasoline prices were almost exactly flat in the US for September, making the likely trajectory from here lower. This is not a sign of accelerating inflation. If anything it signals a slowdown. That would also match with recent reports of inventory builds in the US. Perhaps, oil prices have already peaked.
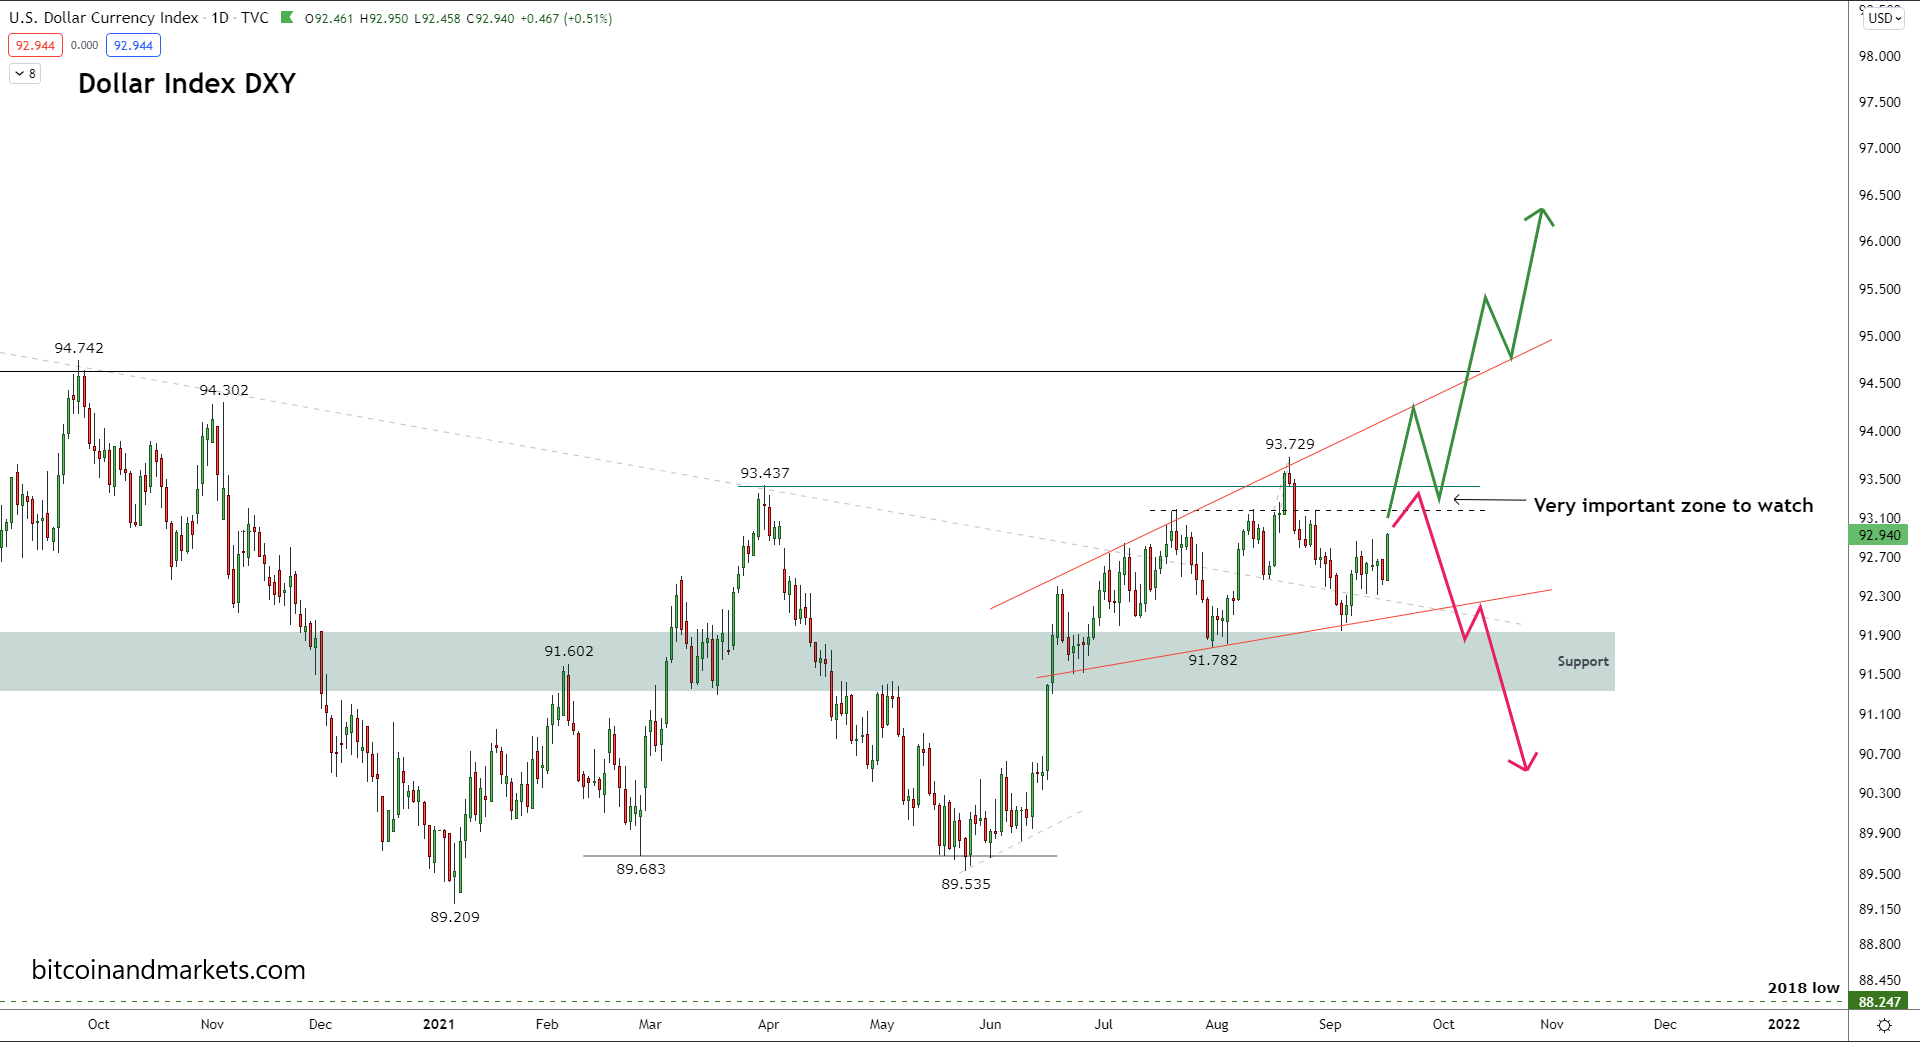
Dollar (DXY)
Last Macro Rundown, I included this chart.
Here is today. There was a little bit of back and forth at the important zone and them it chose a direction. It is currently testing the last area of horizontal resistance at 94.6 before blue skies.
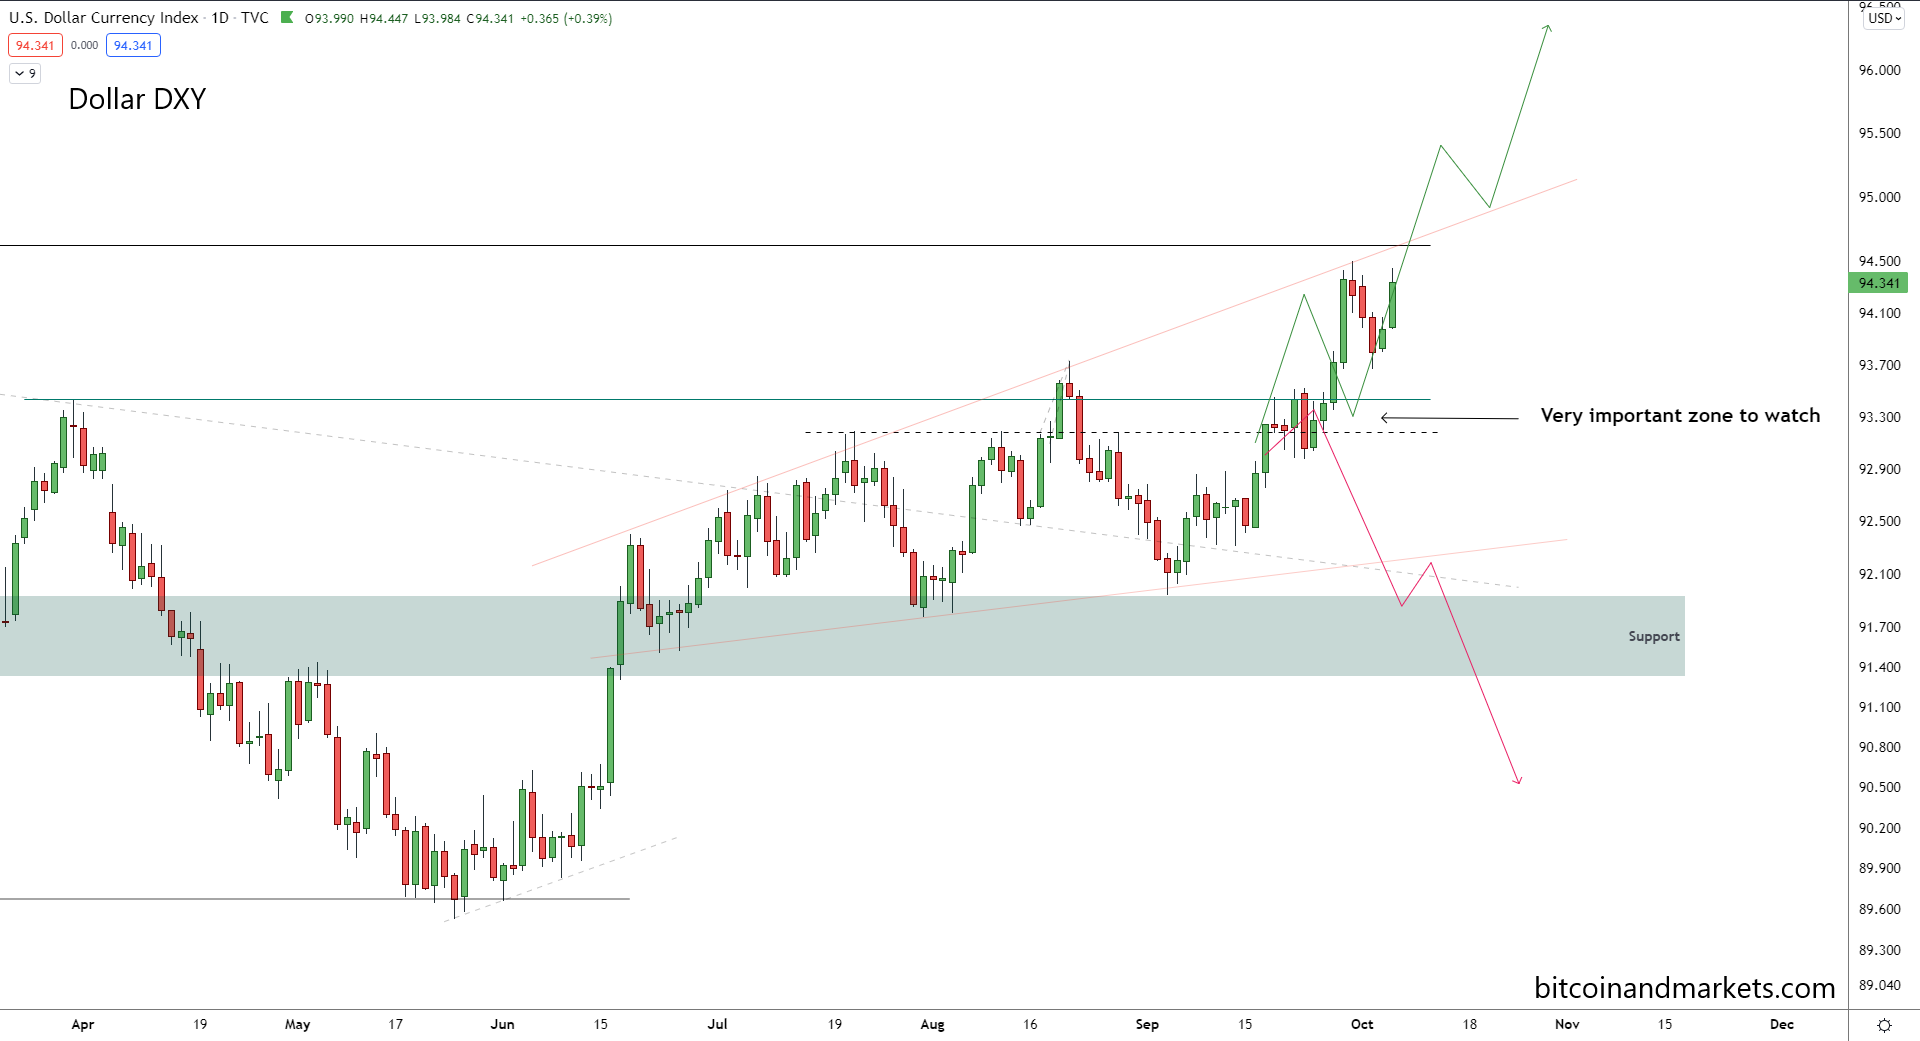
As I have been saying, the dollar and bitcoin are going up together. Crazy huh? That doesn't fit the inflationary paradigm does it? No, we are experiencing massive deflationary pressure from supply chains, shortages, and the like. What is going to happen when businesses can't make their debt payments in coming months and the end of the year?
Imagine you are a business that is facing the music right now. You held on through 2020 going further into debt banking on a quick bounce back to full recovery after this silly corona scare was over. Now you are starting to realize that business only came back 75% and that is now starting to fall off, too. The future holds the real possibility that your business will be cut in half, but your debt payments from 5-years ago or whatever it is, still have to be paid!?
We are looking at massive defaults coming in the next 6 months, a double dip recession, perhaps a small property bubble bursting, and no where in the world is going to be able to pull us out like China did in 2009.
It's going to be okay - especially in the US - but everything is changing rapidly. The smooth, cheap, and abundant globalization that has shaped our habits and culture of the last 50 years is over.
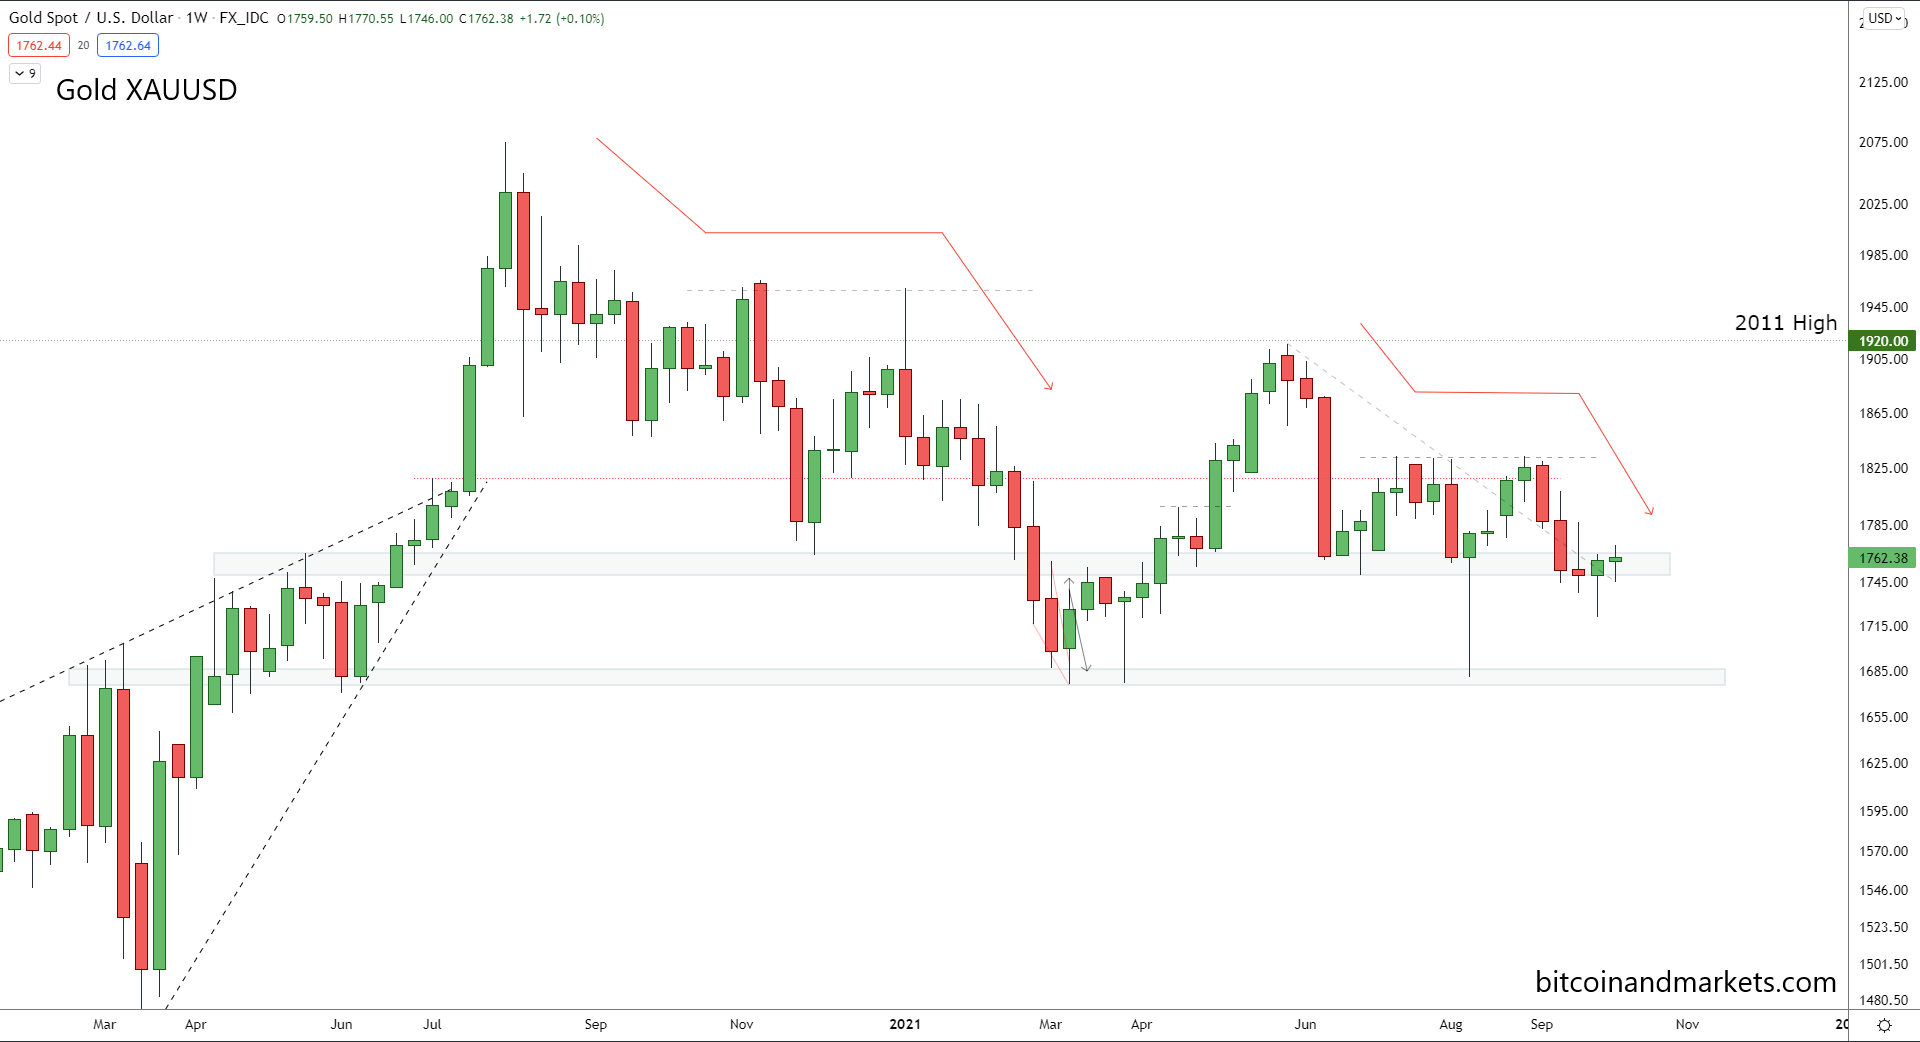
Gold
Gold has been difficult to predict over the last few months. I started the year still bearish thinking it would make it down to $1550, them changed my tune in May, then flip-flopped back again last month thinking it could make it as low at $1550 again. All together, it has been sideways.
Sideways in this environment though is actually bullish. The dollar is about to spike and bitcoin and gold will go with it. Why?
Because a deflationary flight to safety. A counterparty panic which will favor these assets.
As for the chart, price is hanging out in a precarious spot but has held support as bitcoin did as well the last few weeks.
Going back to the GFC in 2008-2009 gold took as initial hit but then started on a 2.5 year 2x rally ending in 2011. This rally corresponded to the worst uncertainty around the European Debt Crisis. Globally people were fleeing to safety as failing counterparties and contagion were everywhere.
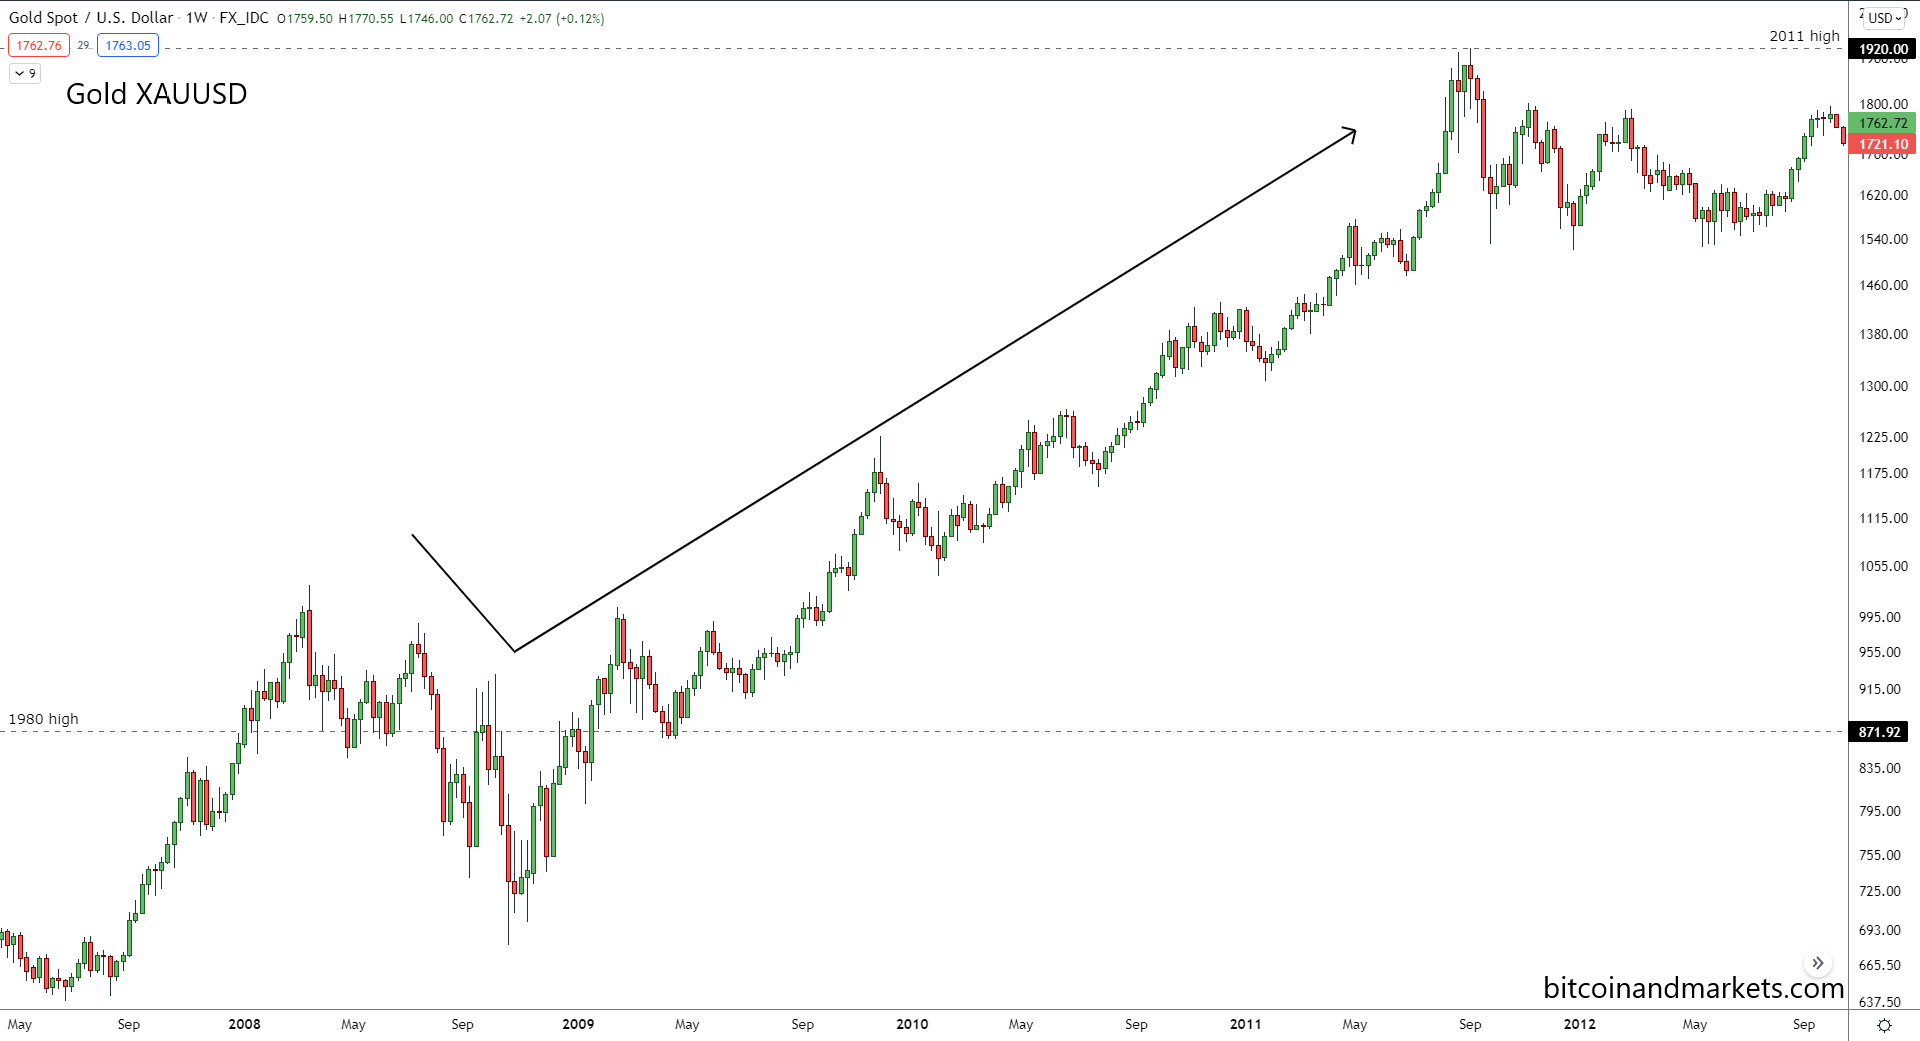
If the same happens this time - perhaps the energy crisis continues to worsen and leads to contagion in their whole economies - gold should perform well again. A similar path would put it at roughly $3000 by 2024. Seems really nice, but not when bitcoin stands to gain 10-20x in that time.
That's where I'm going to leave for this issue. Questions or comments, reach out on twitter to @AnselLindner.