Rethinking The Economic Center Of Gravity
From Rice Fields to Roman Aqueducts: False Models for GDP, Civilizational Complexity, and the False Narrative of a Balanced East and West

I cannot provide this important Bitcoin and Macro analysis without you.
Please consider supporting independent content!
Introduction
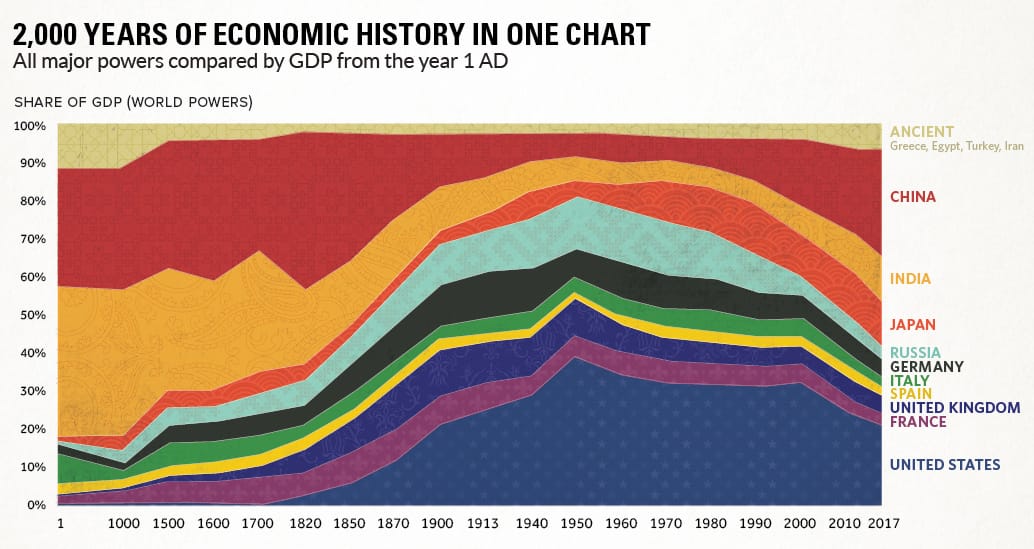
One of the most pervasive macro myths is the idea that China’s rise today represents a simple return to normal. The claim rests heavily on long-term GDP comparisons, most famously from Angus Maddison’s The World Economy: A Millennial Perspective. Think tanks such as McKinsey have built on Maddison’s numbers to produce maps and market projections, including the widely circulated U-shaped “economic center of gravity” chart.
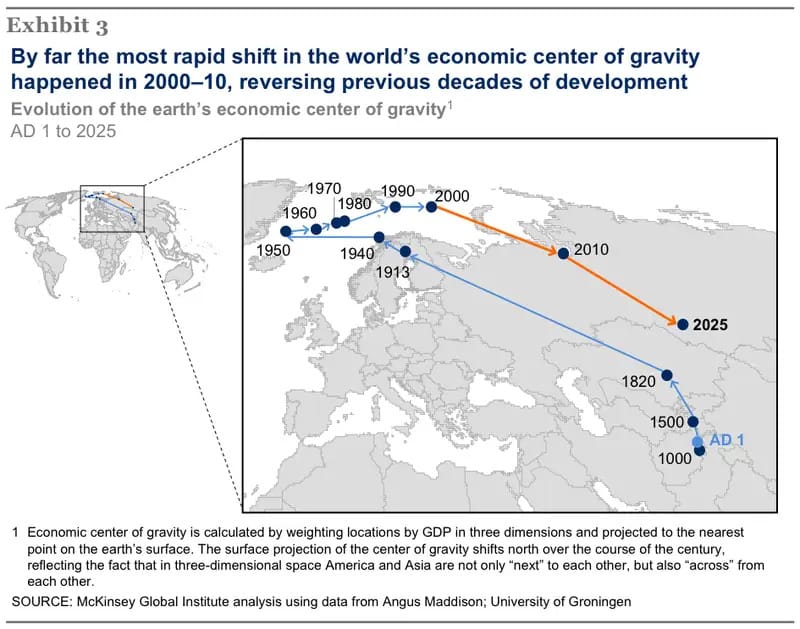
That visualization presents a grand narrative: global economic power was balanced between eastern and western Eurasia until the Industrial Revolution briefly tipped the scale, and China’s resurgence now restores that balance. In reality, this story depends on Maddison’s assumption of uniform per capita output across civilizations until 1800, an assumption that collapses once obvious differences in material culture, infrastructure, geographic dividends, and labor specialization are considered. When evidence is compared across cultures at the same moments in time, Western Eurasia consistently outpaced China and India in productivity per person. The U-shaped curve is not a reflection of history but the artifact of a model that flattens real differences and manufactures a false narrative. This is critical to economic forecasting.
Maddison’s Methods
Maddison’s framework for reconstructing ancient and medieval GDP rests on two pillars: population estimates and assumed per-capita output. Since hard data on production and income before the early modern period is fragmentary, he began by collecting the best available demographic estimates for each region. Onto those numbers he applied a baseline “subsistence-level” GDP per capita, typically set between $400–$600 in 1990 international dollars, and treated it as more or less constant across the world until the 18th century.
Adjustments were occasionally introduced — a higher figure for rice-growing regions like the Yangtze basin, or slight uplifts for commercial hubs such as Venice or the Abbasid caliphate. But these were marginal. The core assumption was global uniformity: that a peasant in Henan, a farmer in the Ganges plain, an engineer in Rome, and a tenant in Gaul all generated roughly the same per-capita economic output for centuries on end.
This methodology has a clear logic: in the absence of direct data, assume equilibrium and then let population do the explanatory work. But it also builds in a systematic bias. If per-capita GDP is flatlined, then civilizations with larger populations automatically dominate the historical tables. That is why Maddison’s reconstructions consistently place China and India at 40–70% of world GDP across most of history, while Europe remains a marginal player until after 1500.
The simplicity of this approach was part of its appeal. It allowed Maddison to create sweeping, long-run datasets that could be graphed, compared, and debated. But the very same simplicity is also its greatest weakness: by reducing pre-modern economies to little more than headcounts at subsistence, it erases obvious differences in complexity, specialization, and enduring output between civilizations.
Academic Criticism
Maddison’s reconstructions have been enormously influential, but they have also attracted sustained criticism across several fronts.
First, the demographic foundations are shaky. Ancient and medieval population figures are notoriously difficult to reconstruct, often relying on fragmentary census data, archaeological proxies, or extrapolations from later sources. Error margins can be so wide that a single adjustment might shift entire percentage points of “world GDP” from one region to another. Scholars like Angus Maddison himself acknowledged the uncertainties, but critics argue the datasets have been used with more confidence than the evidence warrants.
Second, the very idea of applying GDP or PPP to ancient economies has been called into question. Purchasing power parity assumes the existence of globally traded goods and comparable baskets of consumption. Yet in antiquity, most economies were overwhelmingly local, with little integration across regions. Measuring the Roman Empire and Han China in “PPP-adjusted dollars” imports a modern framework into contexts where it doesn’t map cleanly. As historian R. Bin Wong and economist Kenneth Pomeranz have pointed out, such measures risk turning radically different social structures into artificially comparable units.
Third, Maddison’s model has been faulted for flattening cultural, institutional, and technological differences. Economic historians like Stephen Broadberry and Bishnupriya Gupta argue that Europe showed signs of higher productivity centuries before the Industrial Revolution, visible in urbanization rates, wage data, and surviving material output. Treating premodern societies as uniformly subsistence-level economies obscures these differences and leads to counterintuitive results — such as India or China appearing vastly more dominant than Europe at times when the archaeological and textual record shows otherwise.
Taken together, these criticisms converge on a dangerous issue for investors or futurists: Maddison’s figures are misleading about historical norms and trends in relative GDP. They provide a convenient dataset for over-generalized assessments, but they risk reifying a picture of the past that is simply false.
My Critique: Real Comparisons vs Propaganda
Populations of Europe and China were roughly similar up until the late medieval period (around the 14th century, Europe as a whole may have been larger than China or India, definitely not an order of magnitude smaller). At the same time, Chinese agriculture was indeed more productive per acre, but not more productive per worker. Instead, we see obvious ways that directly imply that Western workers were much more productive on average than Eastern workers.
Chinese Agricultural Edge
China enjoyed an edge in agriculture when measured by calories per acre. Rice fields could yield three to five times more calories than Western staples like wheat, barley, or oats. Yet this came at a cost: rice cultivation was far more labor intensive. Chinese historian Philip Huang argued that it required two to three times as much labor per acre as European wheat farming, while Francesca Bray has suggested it might absorb up to five times more once irrigation and double-cropping are included.
The relationship between people and the land shaped the structure of society itself. In China, rice cultivation drove rural population density and a fixation on the peasantry and the census. When the Emperor wanted economic output to grow, the limiting factor was always population. Public policy therefore incentivized demographic expansion. In Europe, by contrast, wheat and barley farming did not produce the same push toward density. Instead, a web of trade routes and urban centers provided alternative paths to efficiency. Land and technology were the binding constraints, and these incentivized innovation, commerce, and specialization.
While agricultural productivity per capita may have been roughly equivalent in antiquity through the Middle Ages, GDP is not only agriculture. To measure output as if every worker were a uniform subsistence farmer ignores the broader economy. The West and broader Mediterranean produced more specialized material output, durable infrastructure, and monuments which required advanced skills, organization, and surplus resources. Reducing GDP to uniform PPP of a basket of goods fails to capture these wider achievements.
This method also builds in a systemic bias for a civilization whose structure favors population growth like China, over others that favor complexity and grandeur. If Europe was building monumental works in stone — hundreds of lighthouses, ports, arenas, and aqueducts — while China was still constructing primarily in timber and rammed earth, the economic weights should reflect that discrepancy. A more accurate estimation of ancient GDP would consider all kinds of outputs. Granted, this is more difficult, but can be estimated, which I'll attempt to do below.
Material Discrepancies
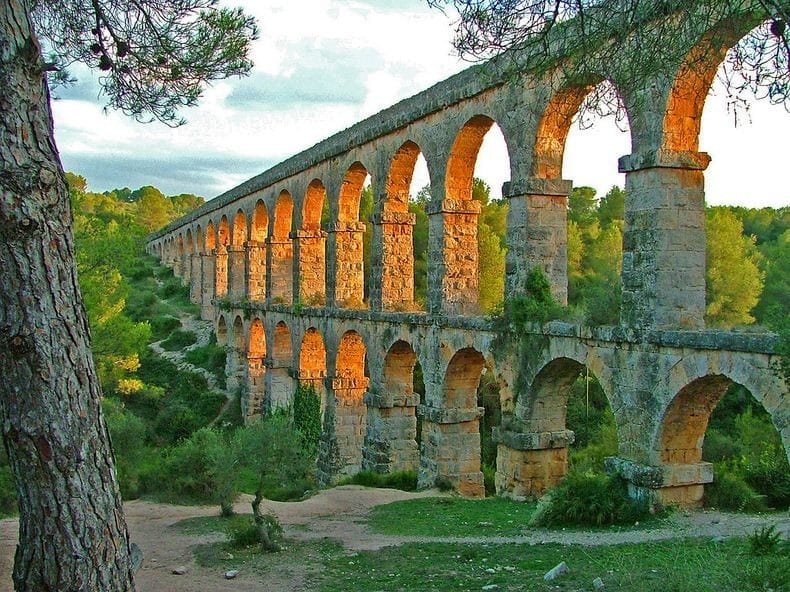
The material legacy of Western antiquity far surpasses that of ancient China if we are honest about it. Europe and the Mediterranean world produced monumental works of stone: aqueducts, temples, palaces, roads, breakwaters and amphitheaters. These required not only immense labor but also specialized skill in engineering, carpentry, joinery, masonry, logistics, transportation, and leadership.
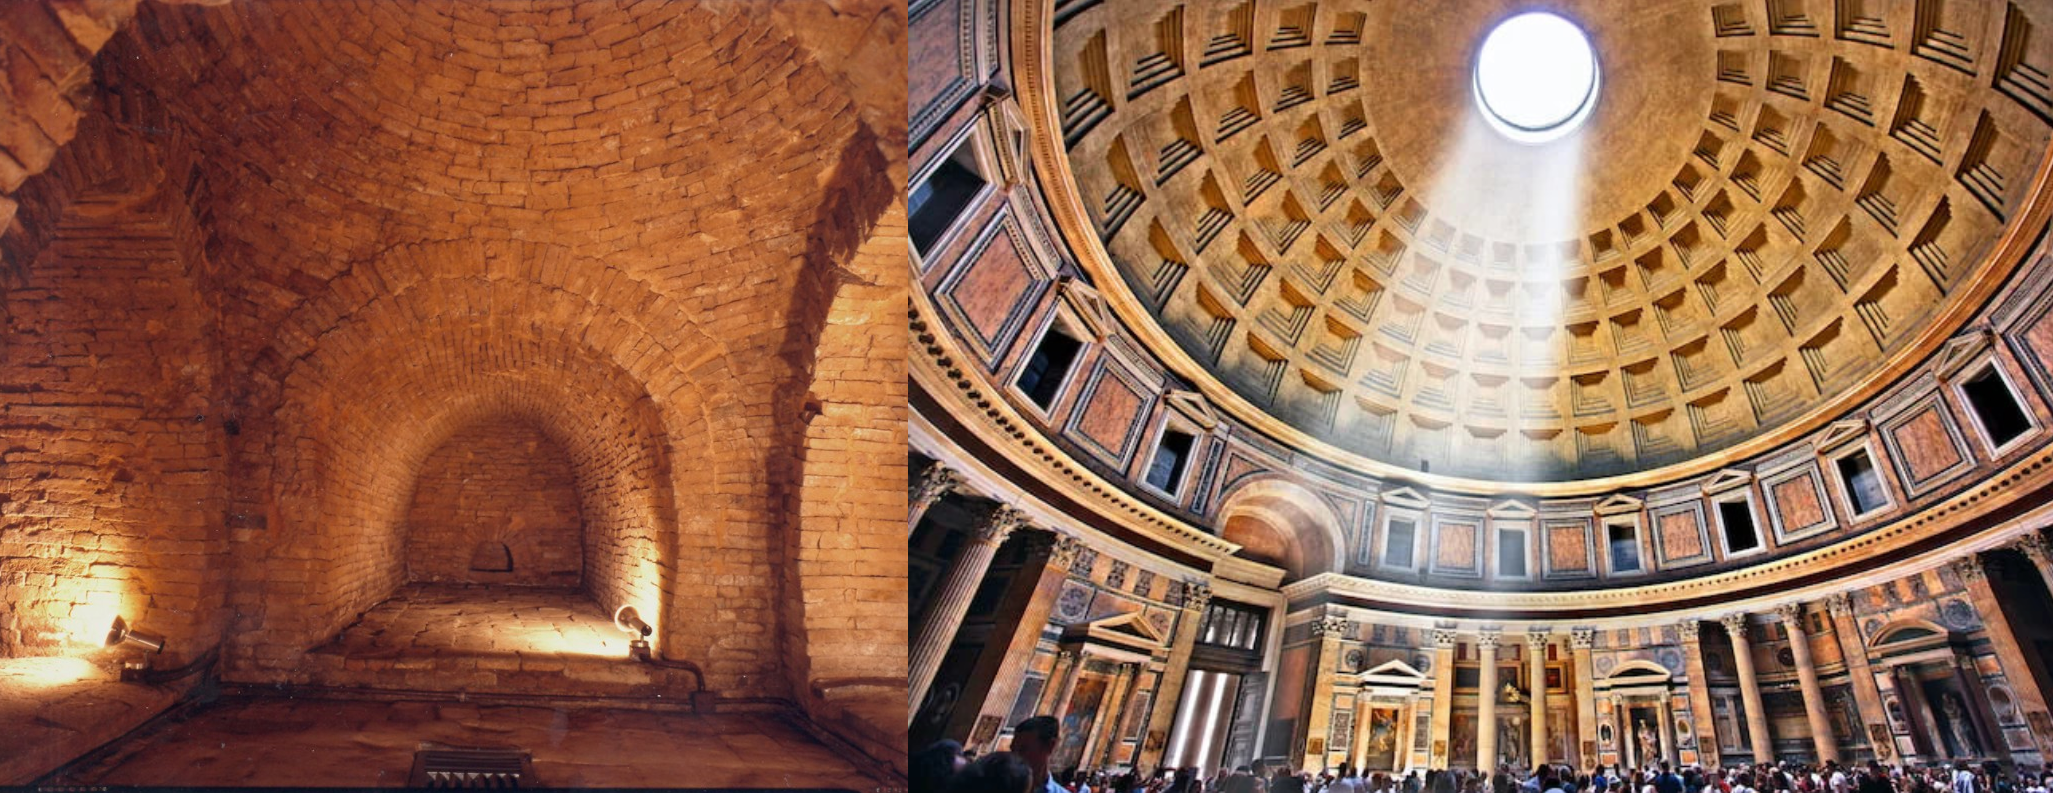
China, by contrast, left behind comparatively little in enduring stone architecture. Wooden pagodas are simply not the feat of complexity that great works in stone are. The Great Wall, at least in the form commonly seen today, is largely a modern reconstruction for tourists. When one compares the Pantheon in Rome (completed in 125 AD) with depictions of wooden pagodas or brick tombs of the era in China, the disparity in scale, ambition, and complexity becomes undeniable.
Many point to the Grand Canal as a monumental feat requiring a complex society. But is that the case? There had been canal projects for centuries, but the Grand Canal becomes a unified system under the Sui Dynasty around 610 AD. Contemporary sources describe its construction as mobilizing millions of forced laborers for massive earth-moving projects. They emphasize human toil, not achievements of engineering and skill. For perspective, five centuries earlier, by 100 AD, the Roman Empire already operated more than 200 aqueducts, covering hundreds of kilometers of monumental stone engineering, through mountains and over valleys, nine of which supplied the capital itself.
Unlike Roman aqueducts or stone-cut canals in the West, the Grand Canal was essentially excavated earth, reinforced with rammed banks and wooden sluice gates. It was shallow and vulnerable to siltation, flooding, and collapse. It was economically vital, but never a monument. There were no stone locks, vaulted arcades, or enduring hydraulic works comparable to those of Rome half a millennium earlier. The “engineering” of the Grand Canal was manpower: digging, dredging, and shifting embankments with baskets. Labor-intensive, but not socially or technologically complex.
Civilizational Preference?
The “civilizational preference” explanation, namely that China simply preferred wood and earth to stone, is not credible. If the social, economic, and engineering capacity had existed, stone would have been used. History shows that every civilization which achieved high levels of surplus and specialization produced durable stone monuments; from Egypt to Angkor, from Greece to the Incas. Stone was not just a building material; it was a marker of permanence, prestige, and power.
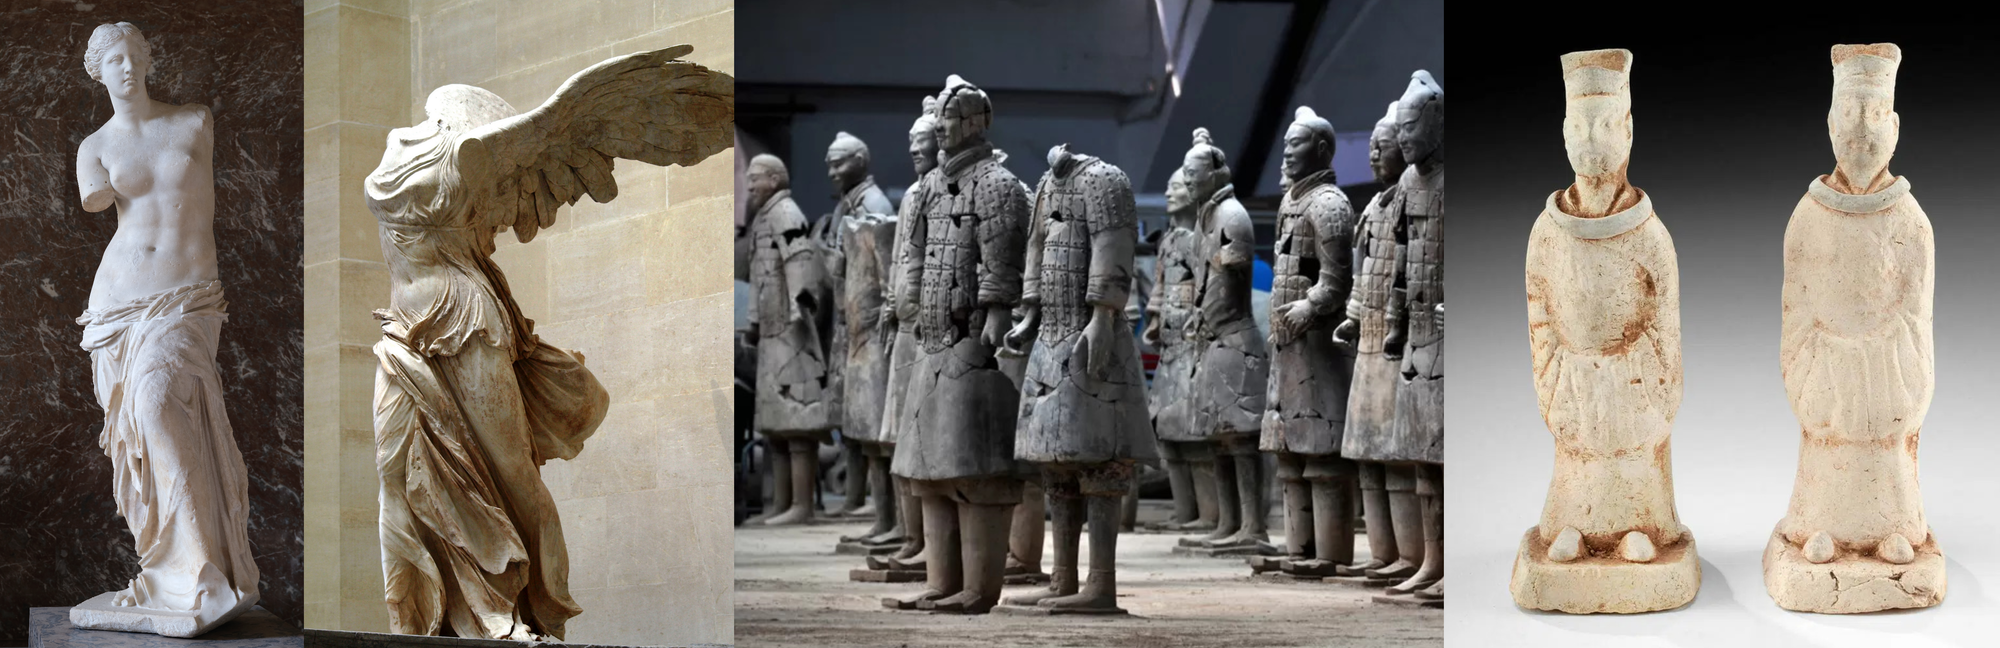
Material culture is a proxy for complexity. Complexity requires surplus, specialization, and technological expertise — all of which are tightly correlated with higher productivity per capita. A society that can produce marble statuary of the Venus de Milo or the Winged Victory of Samothrace is plainly operating at a higher level of specialization than one producing miniature figurines and simple terracotta statues at same moment in history. A society that can build aqueducts spanning valleys and sustaining cities is operating at a higher level of per capita productivity than one conscripting peasants to dig ditches by hand.
Geography, Waterways, and Trade Networks
Another decisive factor ignored by Maddison’s model is geography. Europe and the Mediterranean world were blessed with an extraordinary abundance of navigable waterways, protected seas, and natural harbors.
Rivers
The Mediterranean and Black Seas, together with rivers like the Rhine, Danube, Rhone, Po, Dnieper, Thames, Elbe, and Loire, created a vast integrated system of transport. These waterways connected inland regions to the Atlantic and the British Isles, as well as to North Africa, the Middle East, and beyond.
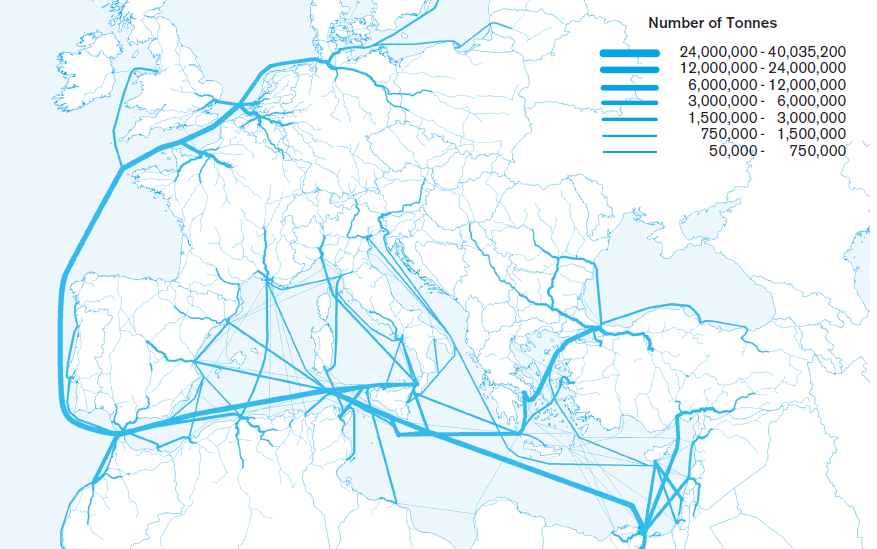
The result was cheaper, safer trade that accelerated the spread of goods and ideas, encouraged specialization, and reinforced Europe’s higher productivity per capita. Even today, waterborne freight is more than five times cheaper than road transport; in antiquity, before paved roads, engines, and standardized containers, the disparity was likely tenfold or more.
China’s geography was far less favorable. The Yellow and Yangtze Rivers were wild, flood-prone, and treacherous. The Yellow River earned the name “China’s sorrow” for its constant devastation, changing course an estimated 1,500 times between 602 and 1946 AD. The Yangtze was calmer in its lower basin but plagued by rapids and floods upstream. While navigable in places, these rivers did not create the same cheap or diverse trade networks as Europe’s waterways.
China's river limitations were so severe that one of China’s great ancient projects was the Grand Canal, which was built precisely to improve the river systems. No such artificial remedy was needed in Europe, where natural waterways already supported robust commerce. This was a massive cost benefit for the West.
Coasts and Ports
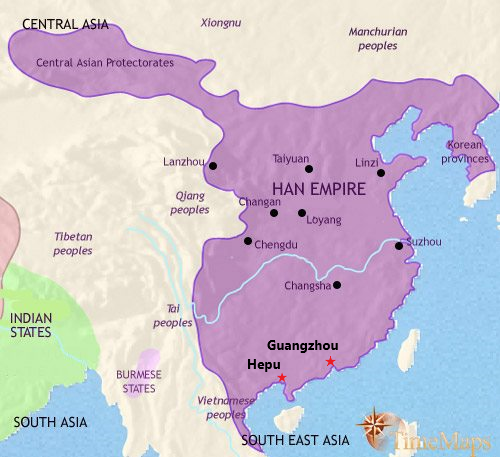
Coastal geography compounded these differences. Much of China’s coast consisted of shallow seas, mudflats, and river deltas, with few natural harbors. Although ports like Guangzhou and Hepu did exist in the Han and Sui eras, maritime trade was marginal, vulnerable to monsoons, typhoons, and chronic piracy.
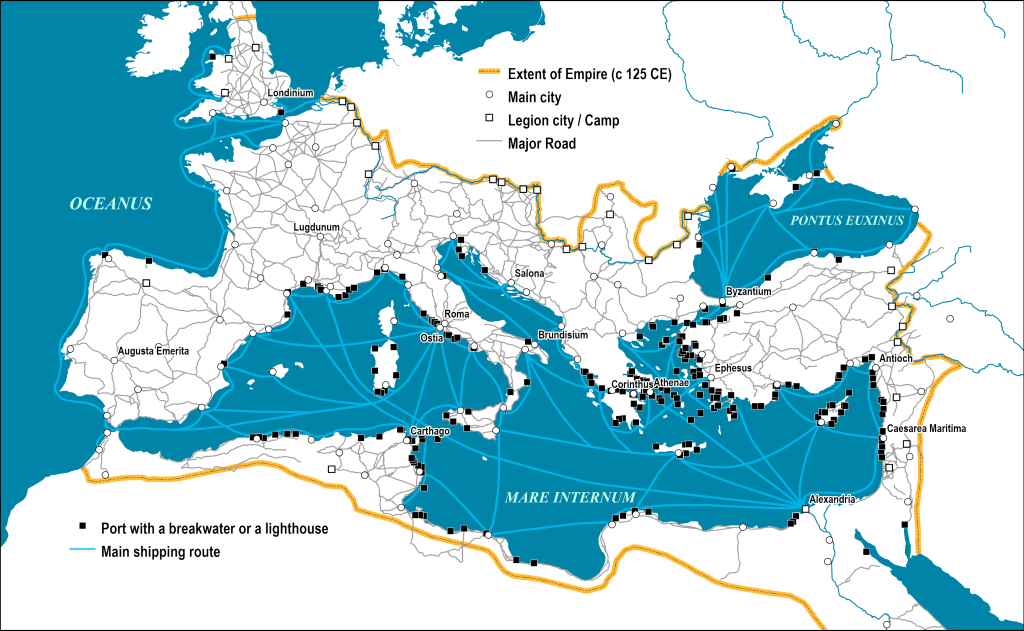
By contrast, Europe’s coastlines were studded with deep, protected ports that became engines of commerce. From Piraeus and Ostia to Marseilles and Alexandria, harbors were not only natural assets but also sites of advanced engineering — breakwaters, lighthouses, warehouses, and customs offices.
The effect on productivity was direct. Cheap, reliable water transport lowers transaction costs, widens markets, and fosters specialization. Europe’s dense and interconnected waterways created structural conditions for higher per capita output, while China’s fragmented and hazardous geography imposed higher costs, greater risks, and less specialization.
Urbanization
In the first century CE, the Roman Empire, Han China, and India exhibited very different patterns of urbanization. Rome had the highest level of urbanization with major cities of Rome, Alexandria, Antioch, and Carthage, and dozens of medium-sized towns of 20-50,000 people that spread urban life widely. Han China concentrated its urban population in a capital city like Chang’an, while the majority lived in dense but still rural villages under the bureaucratic commandery system. India sat between these models, with regional clusters of urbanism in royal centers and port cities such as Pataliputra, Taxila, and Ujjain, linking its agrarian base to long-distance overland and maritime trade.
With equal populations, urbanization levels offer a proxy for relative GDP. Rome, with about 15% urbanization, likely had the highest per-capita output, as dense cities fostered specialization, monetization, and trade. India, around 10% urban, stood in the middle, its ports and royal centers generating wealth through commerce. Han China, at roughly 5%, was the least urbanized, relying on rural surpluses with less economic diversification.
Governmental Styles
In China, vast geography and reliance on grain agriculture favored centralized rule. The state taxed surpluses in kind, stored them in granaries, and redistributed them to feed the court, supply armies, and stabilize famine years. Land reforms like the “equal-field” system ensured a steady subsistence base but discouraged accumulation and specialization. This bureaucracy excelled at sustaining stability and moving grain, yet it limited local autonomy and muted market-driven growth, keeping most of the population tied to agriculture.
In the West, by contrast, the Mediterranean’s geography made trade cheap and decentralized. Medium-sized cities thrived on local markets while connecting into wider exchange networks. This fostered autonomous municipal governments, stronger property traditions, and active associations like guilds and trading companies. In a free-market lens, these were productivity multipliers: they spurred experimentation, diverse production, and competition, raising per-capita output as more people moved beyond subsistence into specialized, higher-value roles.
Implications for GDP Estimates
If GDP is reduced to population multiplied by a flat subsistence baseline, then regions with the largest populations — China and India — will inevitably dominate the ancient tables. But the evidence of material culture, infrastructure, and technological achievement suggests that per capita GDP was far from uniform. Western Eurasia demonstrates higher levels of complexity and specialization, especially in the Roman and Byzantine eras, which, if factored in, would translate into substantially higher GDP.
- From Timber and Earth to Stone: The transition to durable stone societies represents a step change in productivity. Quarrying, long-distance transport, specialized artisans, permanent urban infrastructure, and advanced engineering required far greater surplus and organization. A civilization capable of stone monumentalism could reasonably be estimated as 50–100% more productive than one still building primarily in timber and earth.
- Geographic Dividend: The Mediterranean core enjoyed a clustering of navigable seas and rivers, fertile basins, and short overland links. This sharply reduced transport costs and fostered dense, diversified trade networks. Adjusting for this geographic advantage alone could have made the average person in the West at least 25% more productive than their counterparts in China.
- Urbanization: Higher shares of the population in cities translated into more specialization, monetization, and commercial activity, giving the West a measurable per capita edge, perhaps 10-20%, over more agrarian societies.
- Governmental Styles: Decentralized, city-centered governance in the West fostered competition and innovation, while China’s centralized bureaucracy emphasized redistribution and stability — sustaining scale but constraining per capita growth.
Taken together, these factors point to a historical record very different from Maddison’s flat assumptions. If GDP were recalculated with more weight given to specialization, urbanization, and geography, the economic “center of gravity” would remain far closer to Europe for most of history. The first millennium could have looked more like ~40% Europe and the Mediterranean (West), ~25% India, and ~25% China, with a slight edge to India due to maritime trade and urbanization.
The Industrial Revolution did not suddenly create a “Great Divergence.” It was the culmination of structural advantages long in place. Indeed, the Romans themselves came close to a proto-industrial breakthrough in antiquity — a reminder that the disparity was not new, but centuries deep.
Your support is crucial in helping us grow and spread my unique message. Please consider donating via Strike or Cash App or becoming a member today and get more critical insights!
Follow me on X @AnselLindner.
I cannot provide this important Bitcoin and Macro analysis without you.
Bitcoin & Markets is enabled by readers like you!
Hold strong and have a great day,
Ansel
- Were you forwarded this post? You can subscribe here.
- Please SHARE with others who might like it!
- Join our Telegram community
- Also available on Substack.
Disclaimer: The content of Bitcoin & Markets shall not be construed as tax, legal or financial advice. Do you own research.