Bitcoin Fundamentals Report #215
This week, Bitcoin turns 14!, more global adoption, detailed price analysis, mining sector financial troubles, lightning network news.


Jump to: Market Roundup / Price analysis + Price Conclusion / Mining sector / Lightning Network
In Case You Missed It...
- (Fed Watch) Bulls Are Back, Plus China Congress Fallout - FED 117
- (Fed Watch Clips) 3 New videos on our clips channel!
- (Members) Five live streams this week all uploaded to the Member Drive!
⬇️ Third hour of the below video ⬇️
Listen to podcast here
Market Roundup
| Weekly trend | Possible bull breakout |
| Media sentiment | Negative |
| Network traffic | Very low |
| Mining industry | Some capitulation |
| Market cycle timing | Trying to start rally |
Bitcoin Headlines
- Happy Birthday Bitcoin!!
14 years ago today, Satoshi released the bitcoin whitepaper to a niche cryptography mailing list. The rest is history.
The bitcoin whitepaper is unique amongst this industries' other fake competitors. Where they take 100's of pages of obscure and unproven ideas, Satoshi only took 9 pages including references and calculations, simple, to the point and groundbreaking. For the first time ever, people could transact digitally without a central third party. We had cash for the internet.
Abstract:
A purely peer-to-peer version of electronic cash would allow online payments to be sent directly from one party to another without going through a financial institution. Digital signatures provide part of the solution, but the main benefits are lost if a trusted third party is still required to prevent double-spending. We propose a solution to the double-spending problem using a peer-to-peer network. The network timestamps transactions by hashing them into an ongoing chain of hash-based proof-of-work, forming a record that cannot be changed without redoing the proof-of-work. The longest chain not only serves as proof of the sequence of events witnessed, but proof that it came from the largest pool of CPU power. As long as a majority of CPU power is controlled by nodes that are not cooperating to attack the network, they'll generate the longest chain and outpace attackers. The network itself requires minimal structure. Messages are broadcast on a best effort basis, and nodes can leave and rejoin the network at will, accepting the longest proof-of-work chain as proof of what happened while they were gone.

 Sergio Goschenko
Archived (so scam promoting websites don't get your clicks)
Macro headlines
- Federal Reserve FOMC meeting this week
The Fed's Federal Open Market Committee meets this week starting tomorrow. They will announce their decision on monetary policy Wednesday at 1400 ET.
CK and I will be going live on that day at 1500 ET for Fed Watch Live, where we will cover everything Powell says at the press conference. Join us on Bitcoin Magazine's Youtube or Rumble channels.
As of now, the market expects them to hike 75 bps again, to a range of 3.75 - 4%. Things are getting interesting because market rates are starting to come down. Currently the 10Y yield is at 4.05%. If rates fall this week, the Fed might surprise markets with a smaller hike, which will absolutely rocket markets higher.
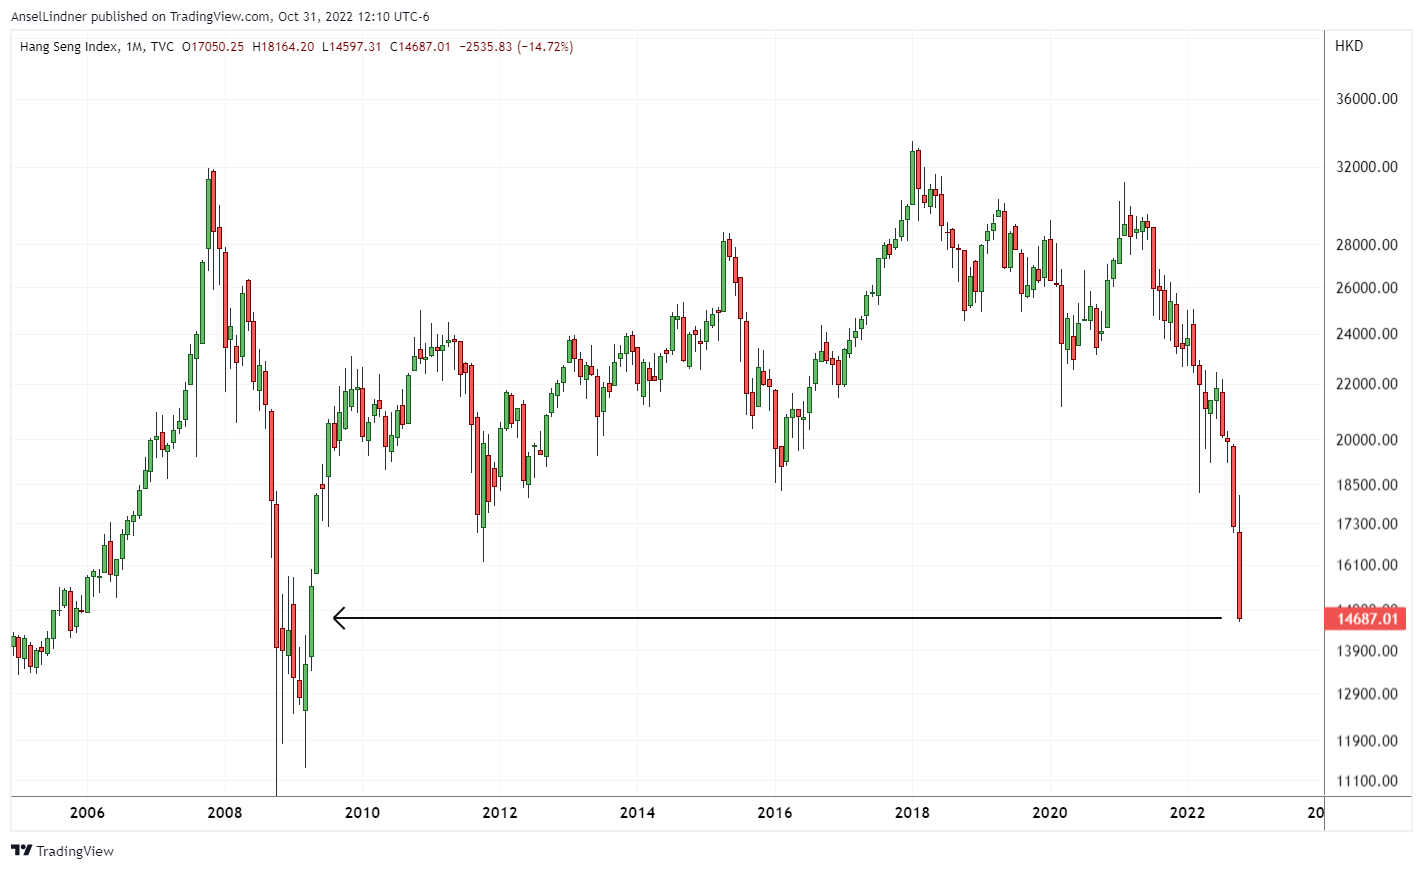
- Chinese markets continue to crash
The Hang Seng exchange in Hong Kong is utterly collapsing, hitting decade lows!!
Price Analysis
| Weekly price* | $20,384 (+$1022, 5.3%) |
| Market cap | $0.392 trillion |
| Satoshis/$1 USD | 4,905 |
| 1 finney (1/10,000 btc) | $2.04 |
Last week:
It's "time to pay attention" as this pattern draws to a close.
Daily chart
Bitcoin has made its initial move as we predicted, breakout upward out of the 4-month long consolidation pattern.
It has regained the 50-day moving average (blue) and is struggling now with the 100-day (red).
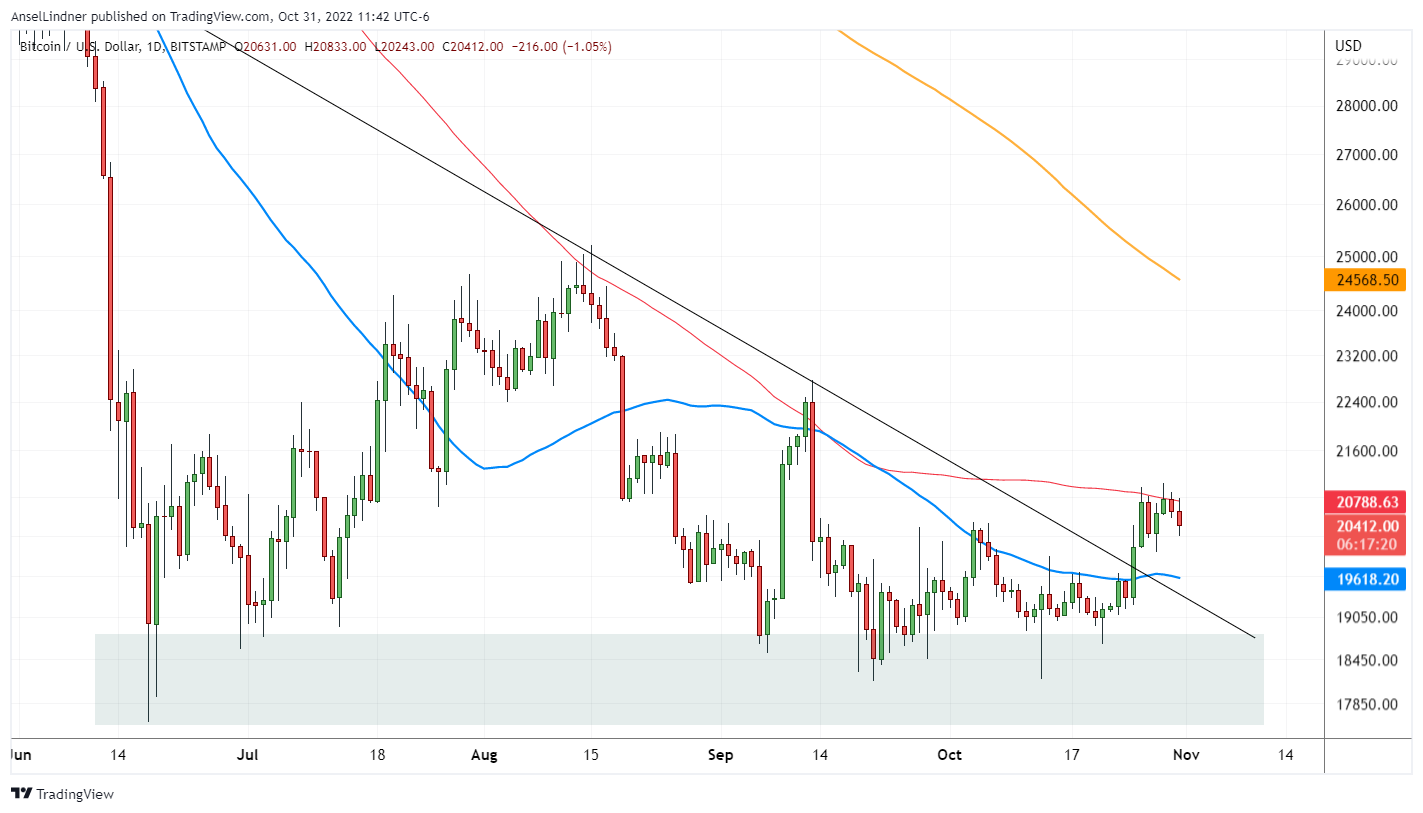
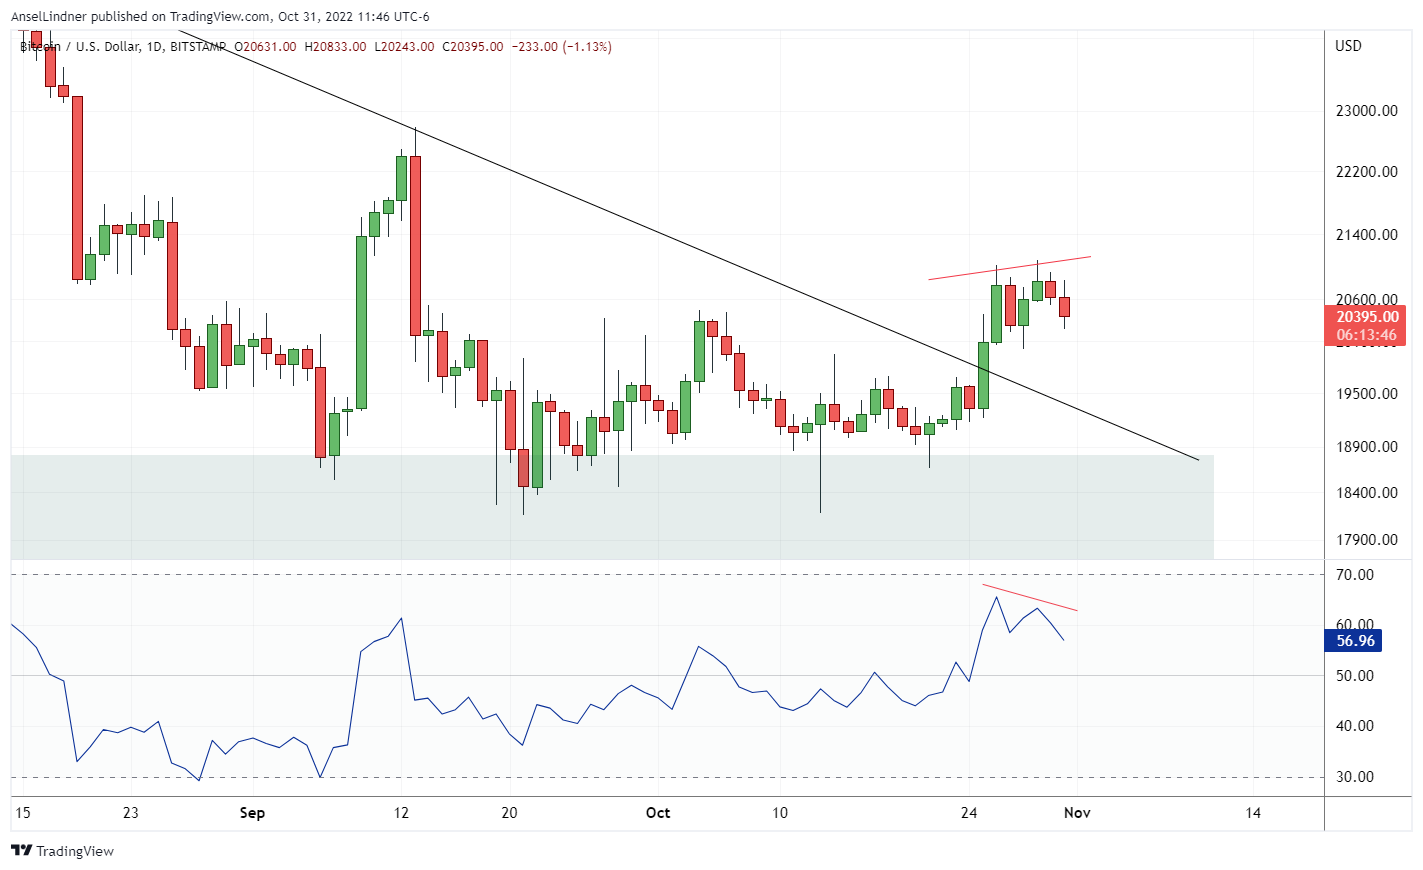
We did see a technical bearish divergence on the daily, with a higher high close, but lower on the RSI. It barely qualified though, and did not take place after an overbought condition, therefore it is not a pristine signal.
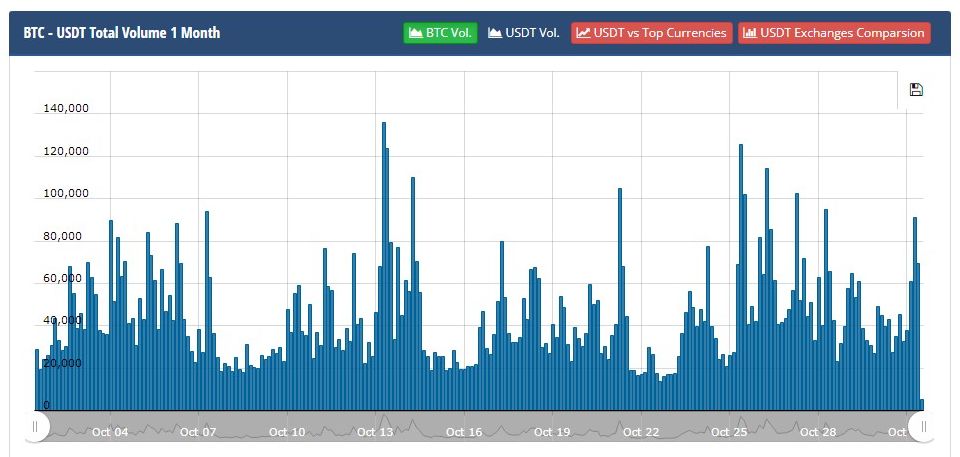
Volume
The chart below is from Cryptocompare and shows a cumulative trading volume for bitcoin. There is perhaps a slight up-tick in volume over the last week, but really not much to confirm an important breakout in price.
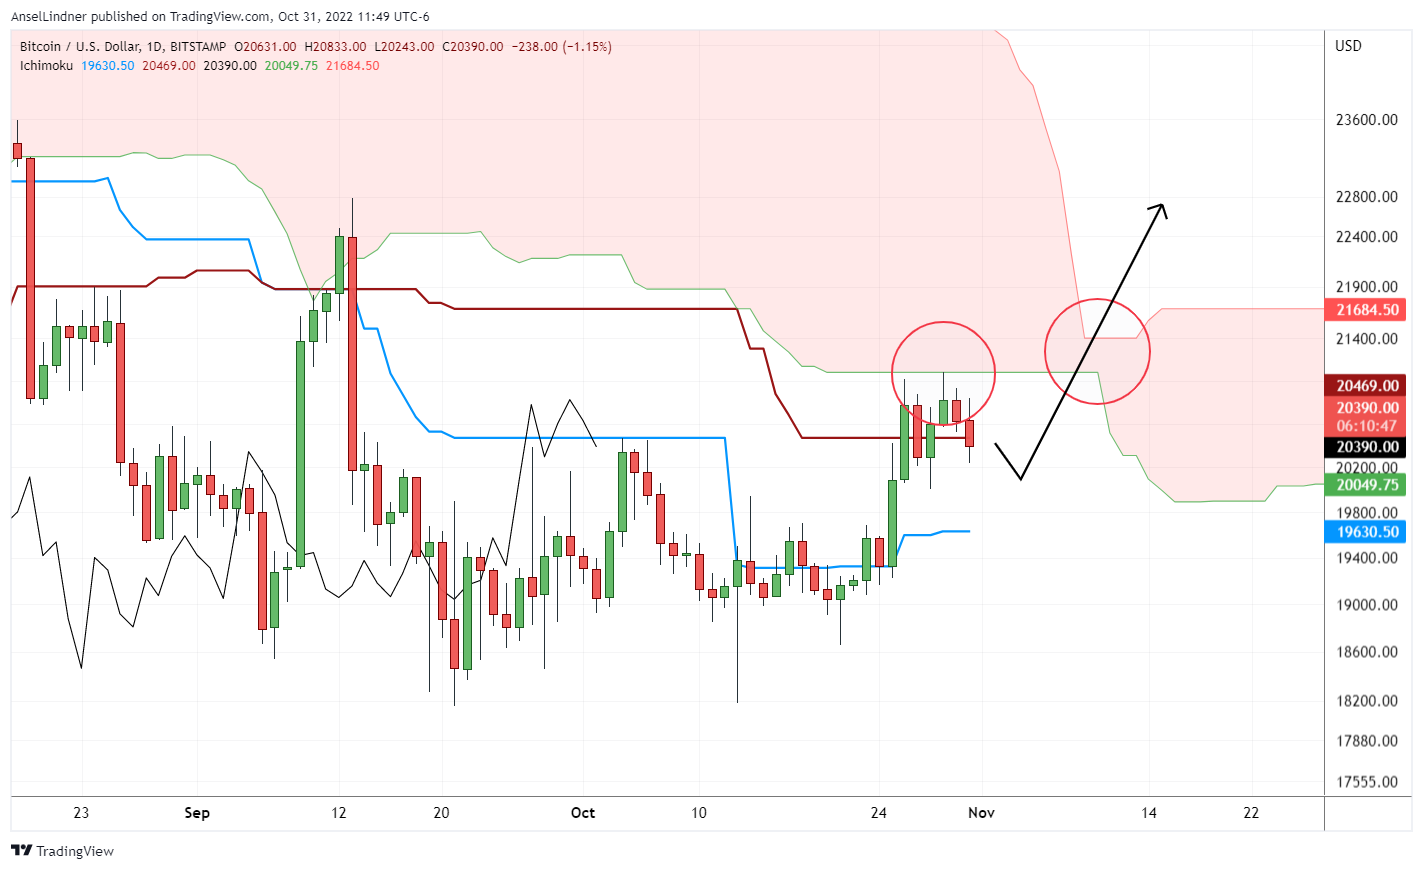
Ichimoku cloud
I haven't used a chart of the cloud in a while, because it does not work well in a sideways market. Now that we have some movement, let's take a look.
On the daily extended cloud (we use extended settings since bitcoin is 24/7/365), we see price hit the cloud to the tick, and is attempting to stay above the Kijun (red line). The TK spread (distance between the blue and red lines) is shrinking, showing a possible sign of reversal. And the cloud itself is shrinking to a narrow point in about a week. Thin clouds are areas that provide less resistance, so are perfect areas for breakthroughs.
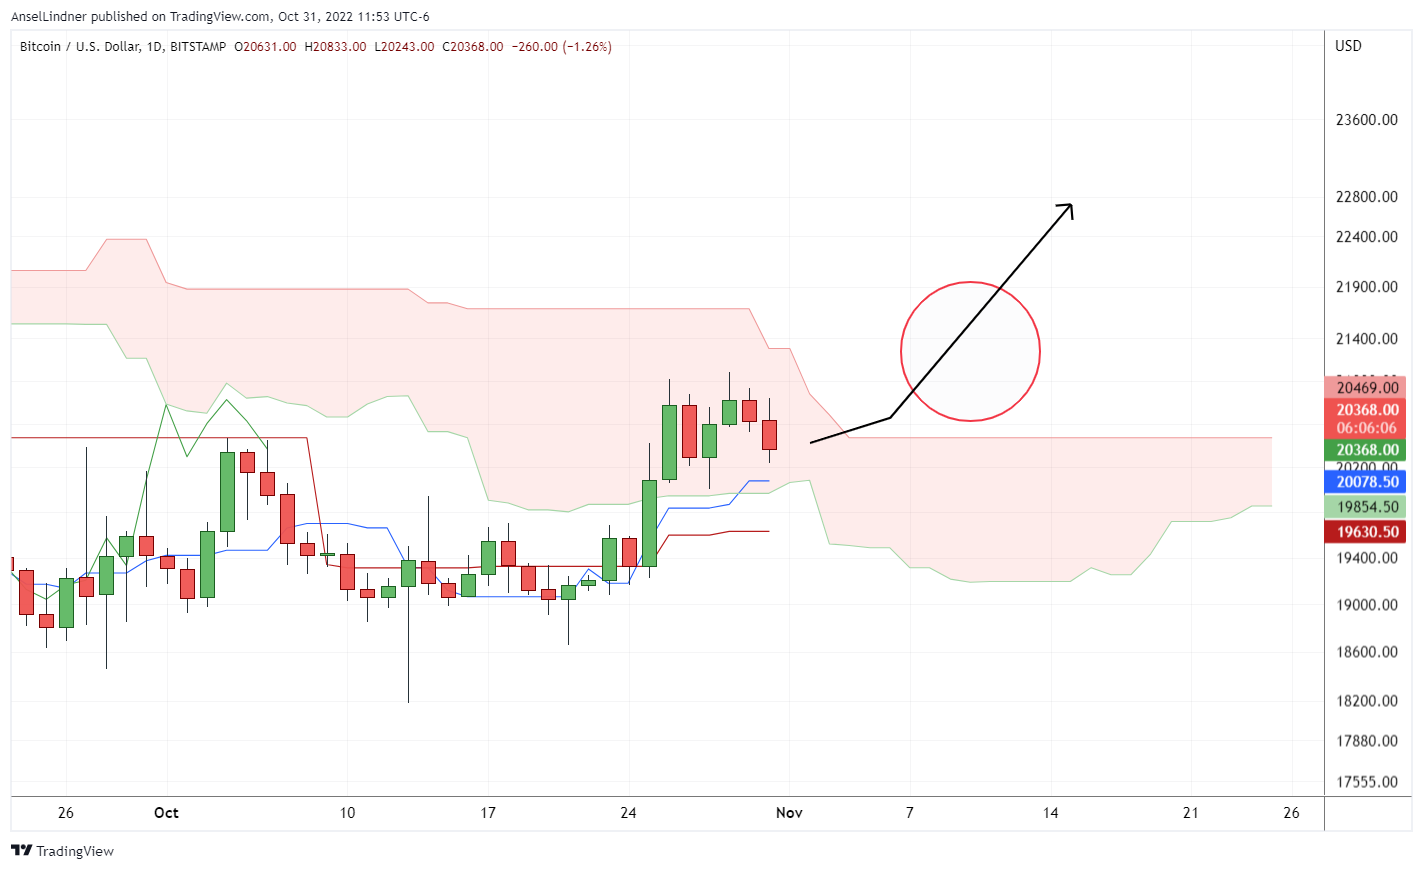
On the standard cloud settings, bitcoin is inside the daily cloud, and approaching a breakout of the other side. The TK spread has already crossed on standard settings as well. I left the right red circle from the extended settings chart to show a similar path to a breakthrough.
Cloud is still red, but much nearer a twist than the extended settings.
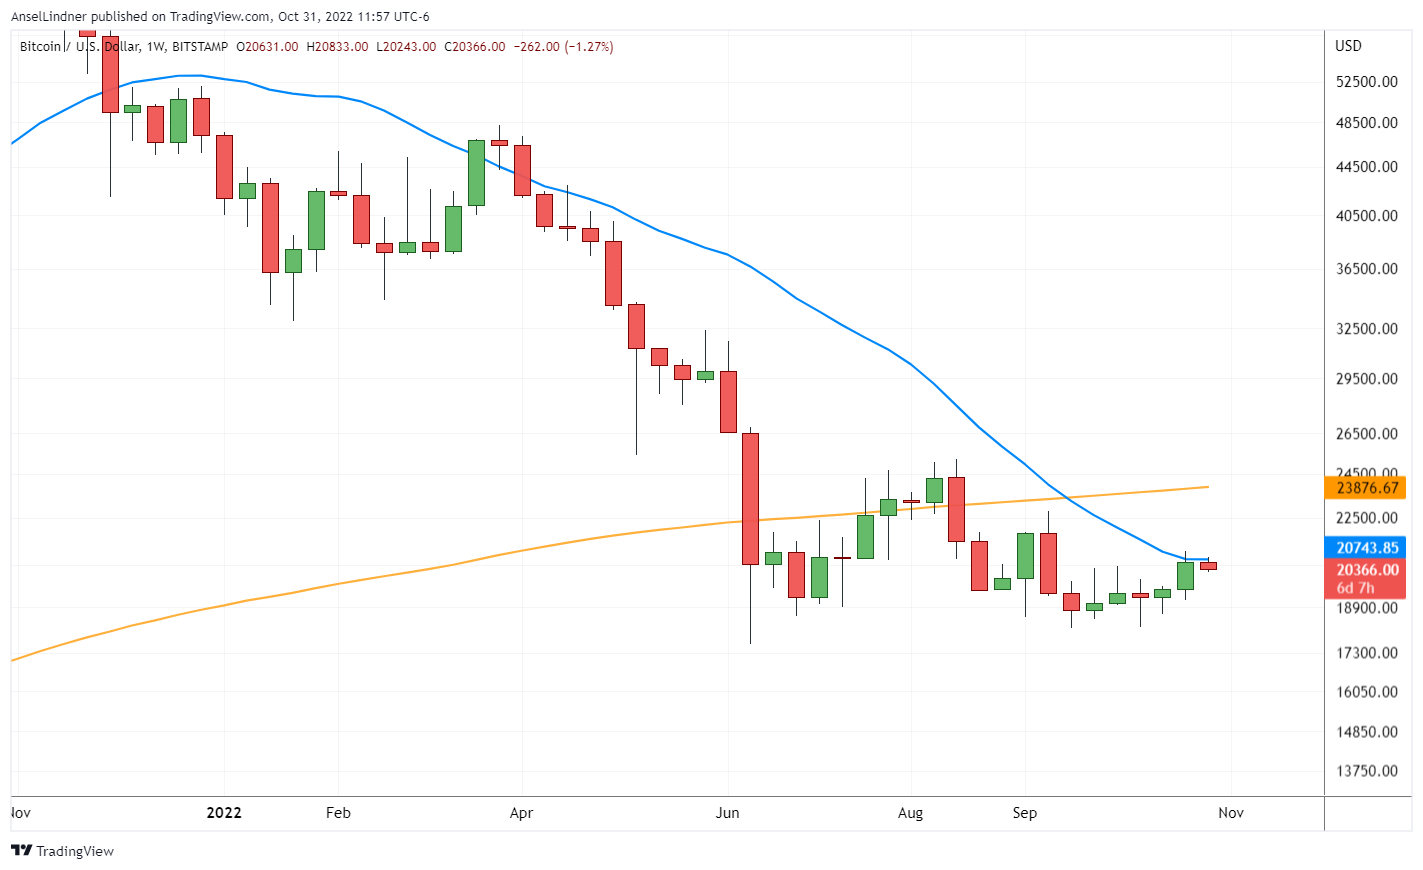
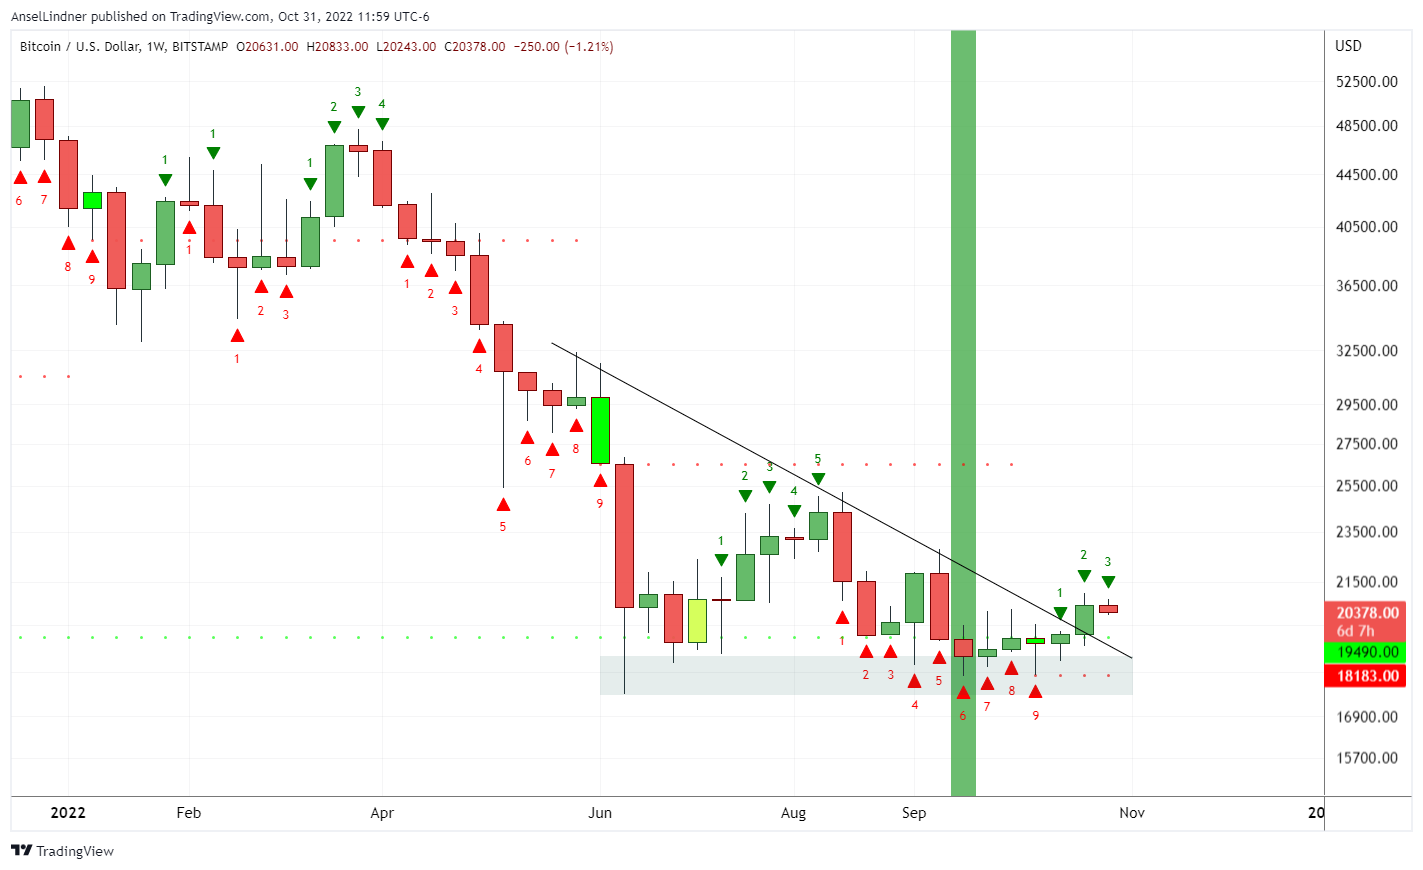
Weekly Charts
The weekly chart continues to be very informative.
Price has rallied right into the 20-week moving average (blue). If it can break that moving average, the next is the infamous 200-week MA in orange.
In the below chart, I combine the TD sequential, showing that beautiful Red 9 reversal before the end of the pattern and breakout. I also put on there the bullish divergence on the weekly, which is the first one in bitcoin history as well as being at a very historically oversold position.
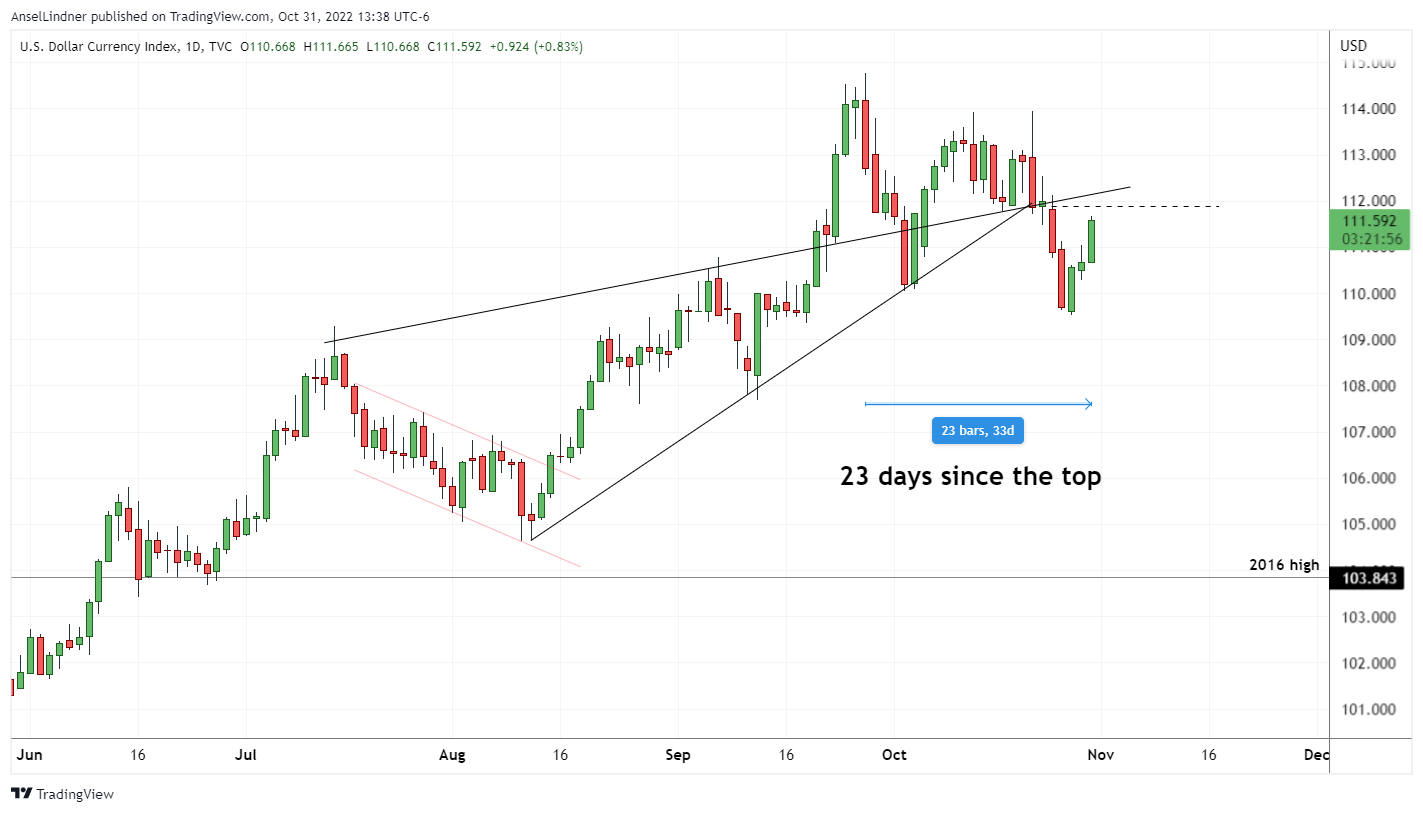
Headwinds and Tailwinds
Dollar
The dollar has massively cooled over the last couple of weeks (except for China). It's been 23 trading days since the top on 28 September.
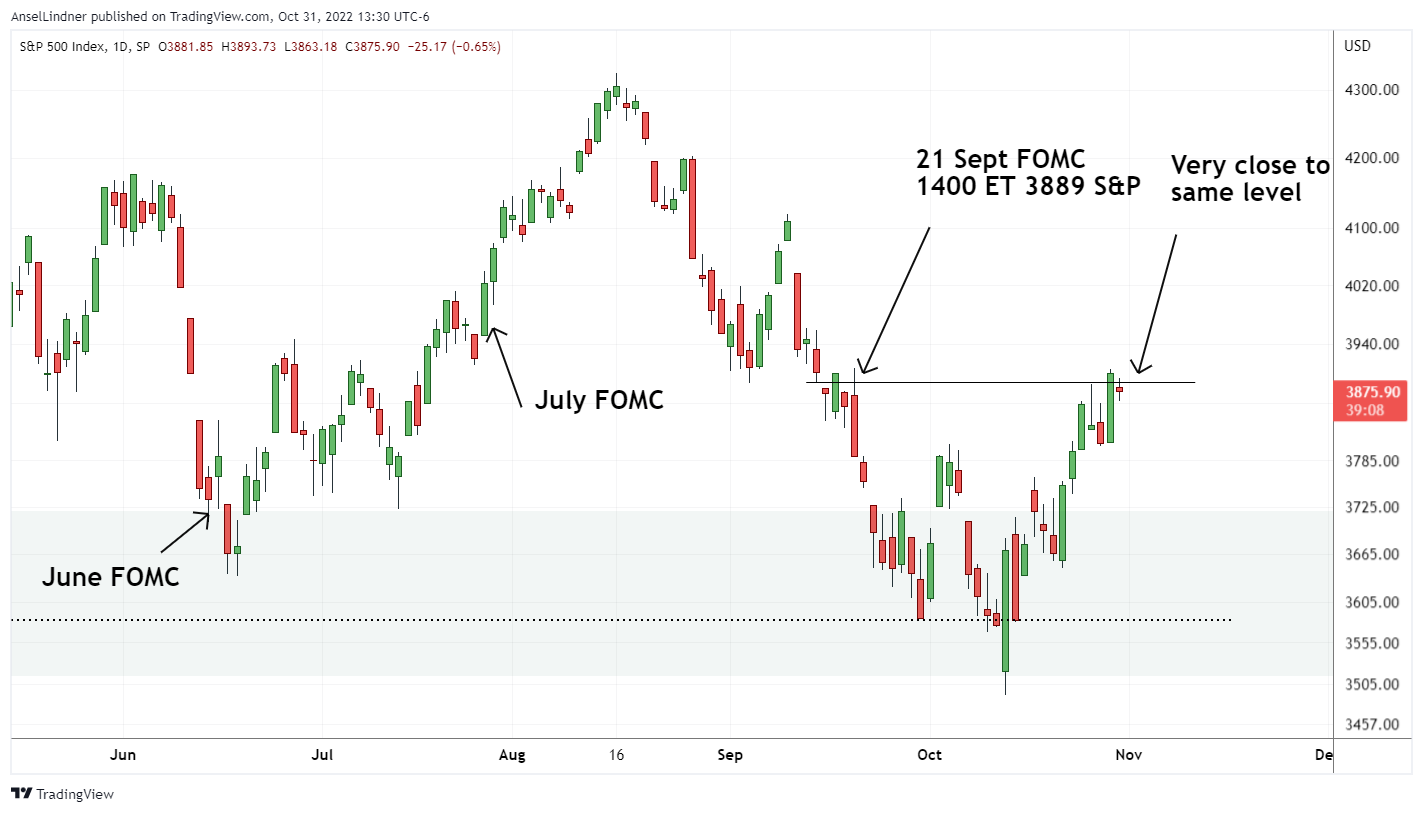
Stock Market
On the chart below, we can see a couple strong weeks. This is different that the Sept FOMC meeting that saw stocks sink for a few weeks heading into that decision.
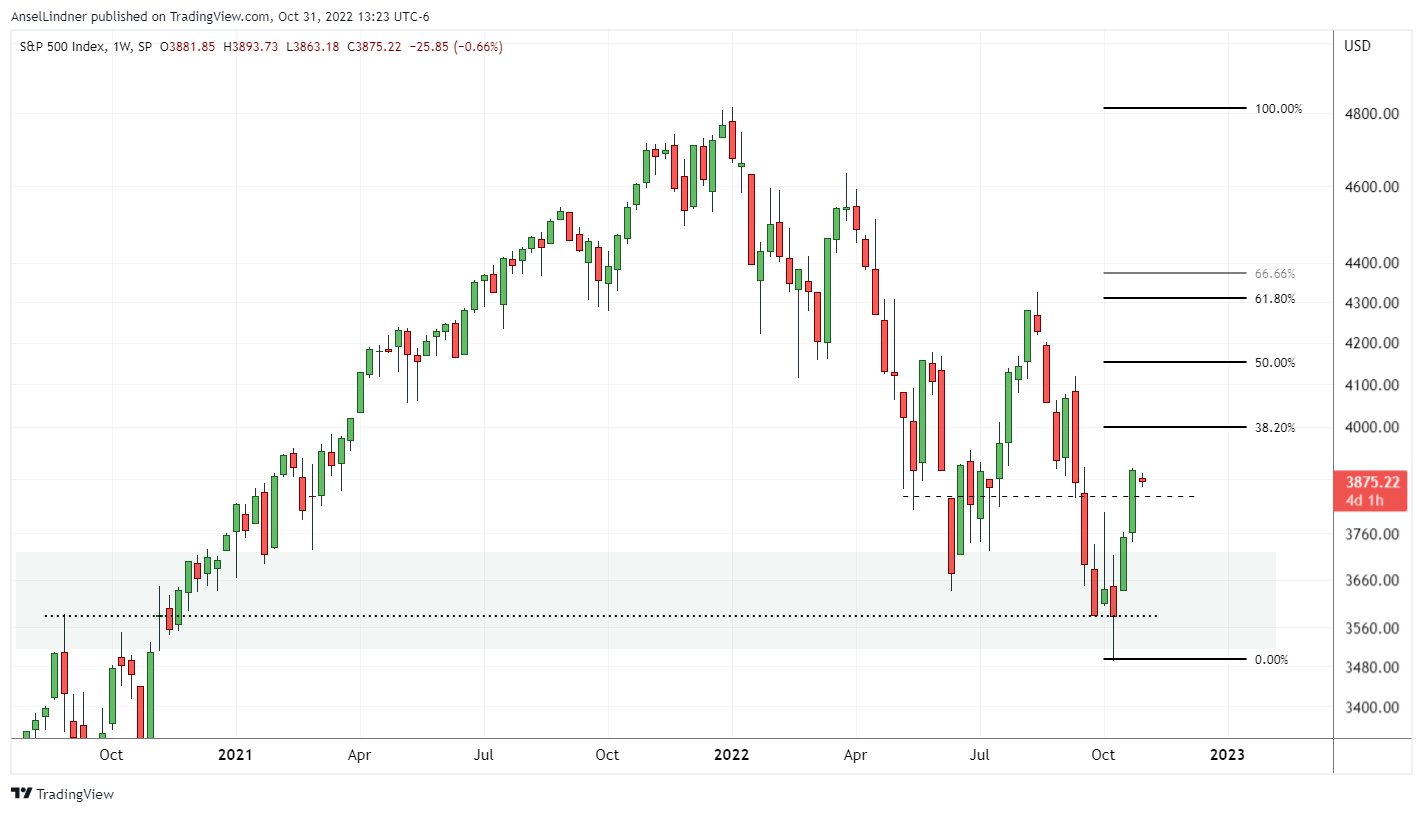
Despite all the craziness. The S&P 500 is nearly bang-on the same level as at the Sept 21 policy announcement.
The general economy
Many people think the economy being bad is also necessarily bad for bitcoin. It is not. As I've reiterated several times, stocks and other risk assets (including bitcoin to a high degree) are FORWARD looking. Price today is the risk the market is pricing in months or even quarters down the road.
Therefore, if the price of stocks and other risk assets start going up right now, that reflects the expectations for the general economy 6-12 months in the future. This phenomenon often makes people think that the market is "irrational" or "manipulated", when it is just forward looking.
Economic numbers reflect backward looking data, some extremely lagging, like housing data. Housing data is 6-12, or even 18, months behind currently evolving conditions. So, if you are trying to use housing data to explain the stock market, you are up to 2 years behind.
That is not to say that the economy is not slowing, it is. Prices are high. Employment is... stable for now. Stock markets across the board (except China) are telling us that things will remain slow but not horrible 6-12 months in the future.
3-month to 10-year inversion
It finally happened this week, the 3-month Treasury inverted the 10-year. As you can see in the chart below of this spread, the market had been waiting for this for months now.
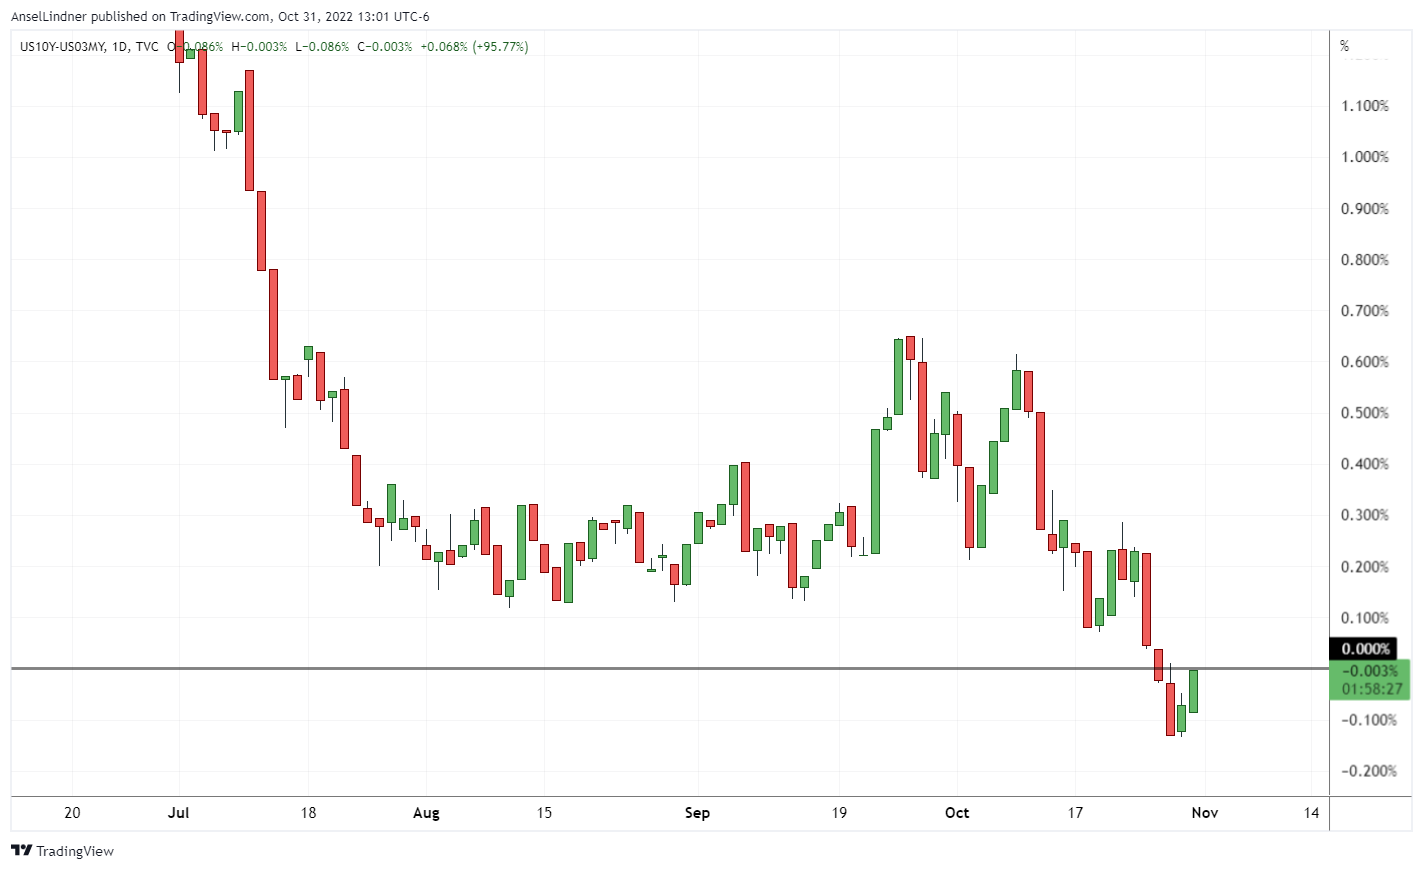
This indicator is never wrong in predicting a recession. How do I square that with the above commentary on the stock markets? Well, I consider the first half of this year as a recession, despite the NBER not officially calling the 2-quarters of negative GDP growth a recession. Also, Q3 was big time positive, at a 2.6% annualized rate.
As I've said for months, the US economic trajectory, and perhaps much of the world, will be in and out of recession for the next couple of years or so. If Q4 2022 is slightly negative GDP growth, and Q1 2023 is slightly negative, boom back into recession. Then Q2 is positive again. In and out, in and out.
That would square the stock market bouncing around and not having a capitulation leg. It is trying to price in being in and out of recession for a couple years.
Price Conclusion
Summarizing...
After a historically stable period for bitcoin's price, it appears to have picked a direction.
The daily charts show some nice signs of bullish action, with a couple areas of concern. Ichimoku clouds are setting up for a big move a week from now, if bitcoin can hold on until then.
The weekly charts are bullish. Several reversal signals I've been reporting on here has coalesced in this break out. Price is pressing on the 20-week moving average, attempting to breakthrough.
Acute dollar stress has weakened, which will ease liquidation pressure on other assets.
We see stock markets globally are bouncing, except for China. The general trend remains what I've been saying for years, back to post-GFC normal, into and out of recession, near zero growth. Bitcoin will eventually rally hard in that environment as an alternative money without the heavy debt burden.
Overall, the risk of a crash in bitcoin is lower week after week. We are waiting for volume confirmation of the breakout. Be careful of a dip coinciding with the FOMC announcement Wednesday. The next few days could be a little slow for price leading to action later in the week.
Mining
| Previous difficulty adjustment | +3.4397% |
| Next estimated adjustment | 0% in ~6 days |
| Mempool | 1 MB |
| Fees for next block (sats/byte) | $0.43 (14 s/vb) |
| Median fee (finneys) | $0.03 (0.014) |
Mining News
Lots can change in a week. From unfounded rumors of a secret new miner to two large bitcoin miners having imminent solvency issues.
This recent news highlights forced selling by miners that might be coming to an end now as they enter some legal bankruptcy protection.
One of the world’s largest #bitcoin mining firms Core Scientific, is halting all debt financing payments - SEC Filing pic.twitter.com/iSlxCIgD2f
— Dylan LeClair 🟠 (@DylanLeClair_) October 27, 2022
As previously disclosed, the Company’s operating performance and liquidity have been severely impacted by the prolonged decrease in the price of bitcoin, the increase in electricity costs, the increase in the global bitcoin network hash rate and the litigation with Celsius Networks LLC [...]
In addition, the Board has decided that the Company will not make payments coming due in late October and early November 2022 with respect to several of its equipment and other financings, including its two bridge promissory notes.
Core Scientific has also sold over 1,000 btc this month to try to stay solvent. Celsius reportedly owes Core over $2 million in unpaid bills, forcing them into this position.
 Alys Key
Shares in crypto miner Argo Blockchain have plummeted after the company revealed that a planned £24 million ($27 million) fundraise will no longer go ahead.
"Should Argo be unsuccessful in completing any further financing, Argo would become cash flow negative in the near term and would need to curtail or cease operations." - Shareholder statement
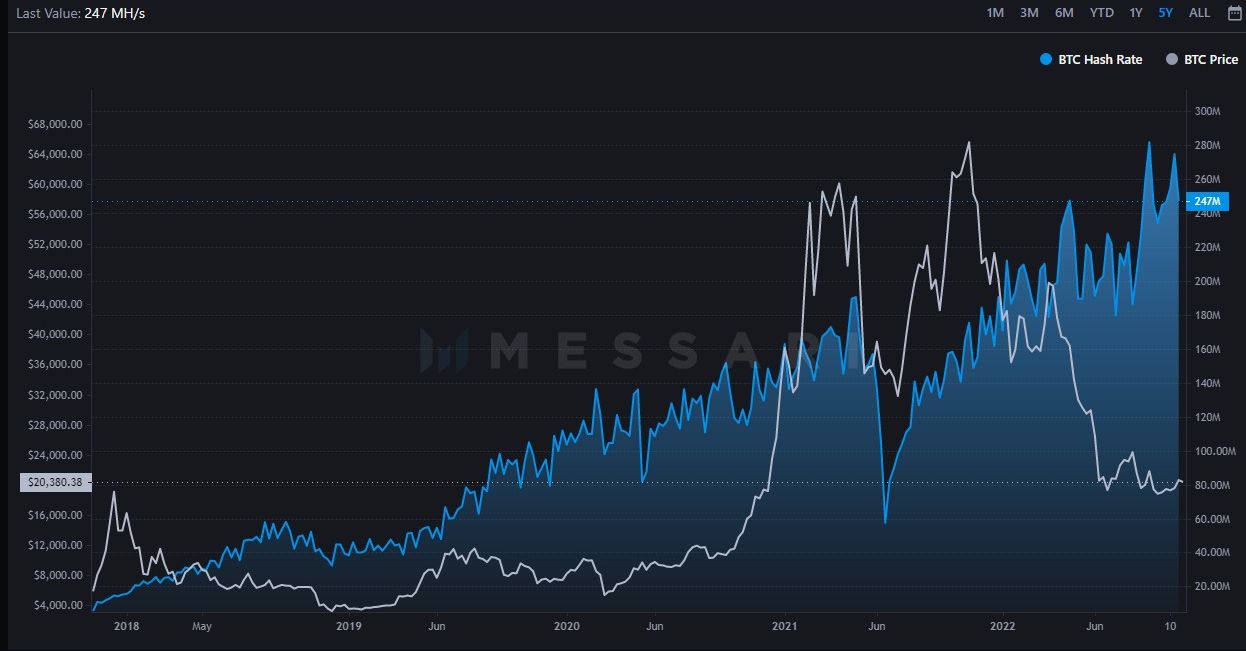
Difficulty and Hash Rate
Hash rate is giving no room to these struggling miners. It is estimated to be a flat difficulty adjustment in 6 days of roughly 0%.
Lightning Network

- Cash App users can send and receive payments in BTC via the Lightning Network.
- Previously, the app could only send on-chain BTC payments.
- Cash App has an active user base of 47 million, over six-times larger than the population of El Salvador.
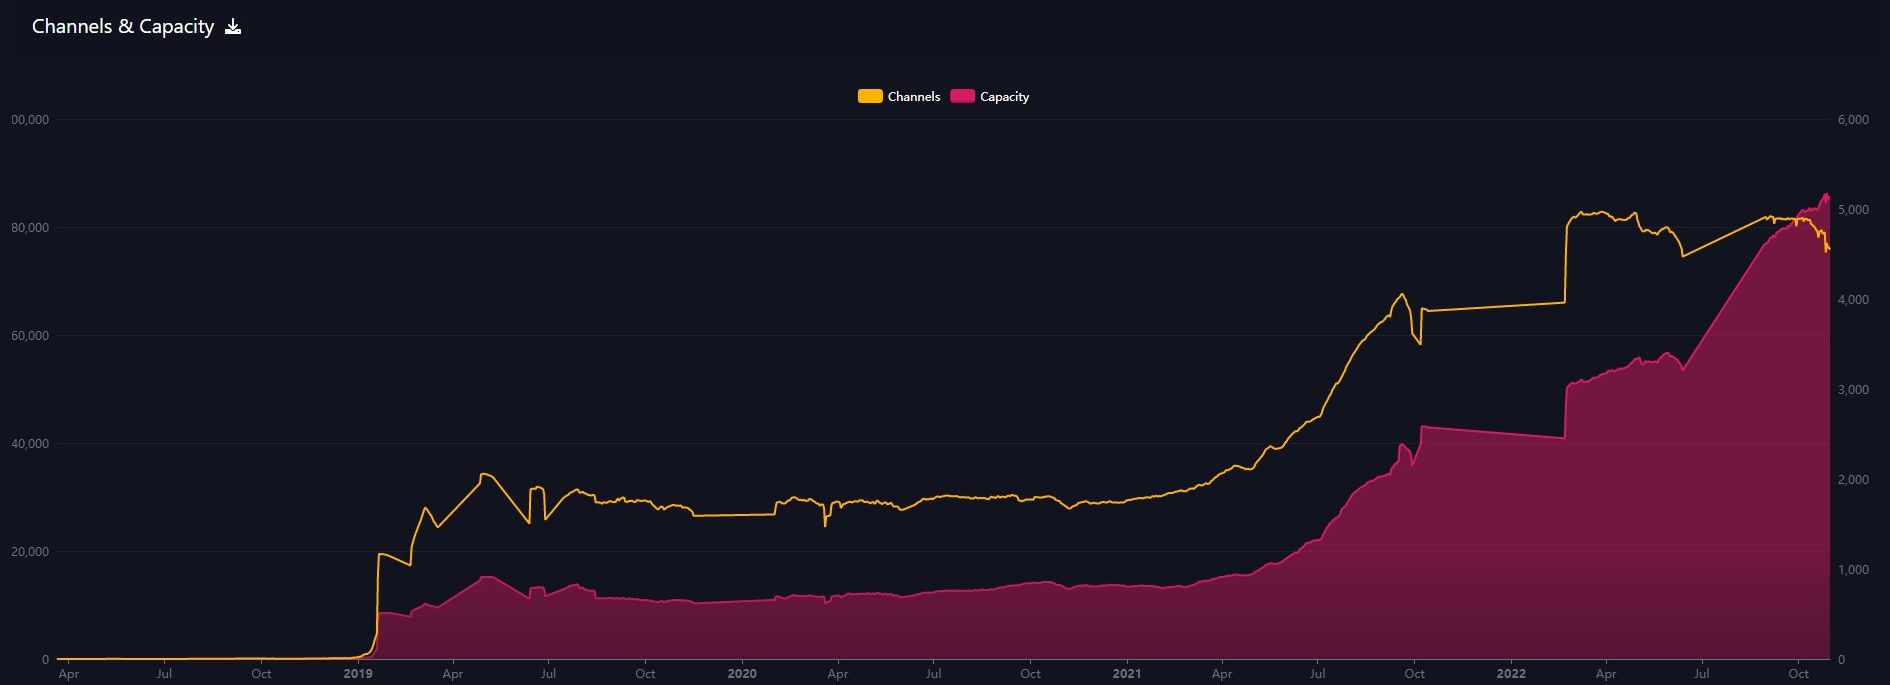
Capacity
Lightning network capacity continues grow, now standing at 5,132 btc.
That's it for this week. See you again next Monday!!!
A
- Were you forwarded this newsletter? You can subscribe here.
- Podcast links and socials on our Info Page.
- If you liked this newsletter please SHARE with others who might like it!

October 31, 2022 | Issue #215 | Block 761,161 | Disclaimer
* Price change since last week's report