Major BTC Price Reversal Is Coming | Signals Hidden In Bitcoin ETF Flows
Institutional bitcoin ETF investors held firm through the downturn, and the flow data now points toward a possible market turning point.

Bitcoin & Markets | Mar 9, 2026
Welcome to my weekly “One Chart” posts. These public posts are meant to be short, one or two charts with a brief explanation.
Make sure you're SUBSCRIBED!!
Today we’re looking at bitcoin ETF flows.
The first chart below shows that cumulative flows have remained relatively strong compared to price. You can see the black solid price line dips much more than the colored columns representing ETF AUM. While price fell from $126k to $59k at the bottom (-52%), ETF cumulative flows only declined from $87B to $80B (-8%).
That’s a big deal.
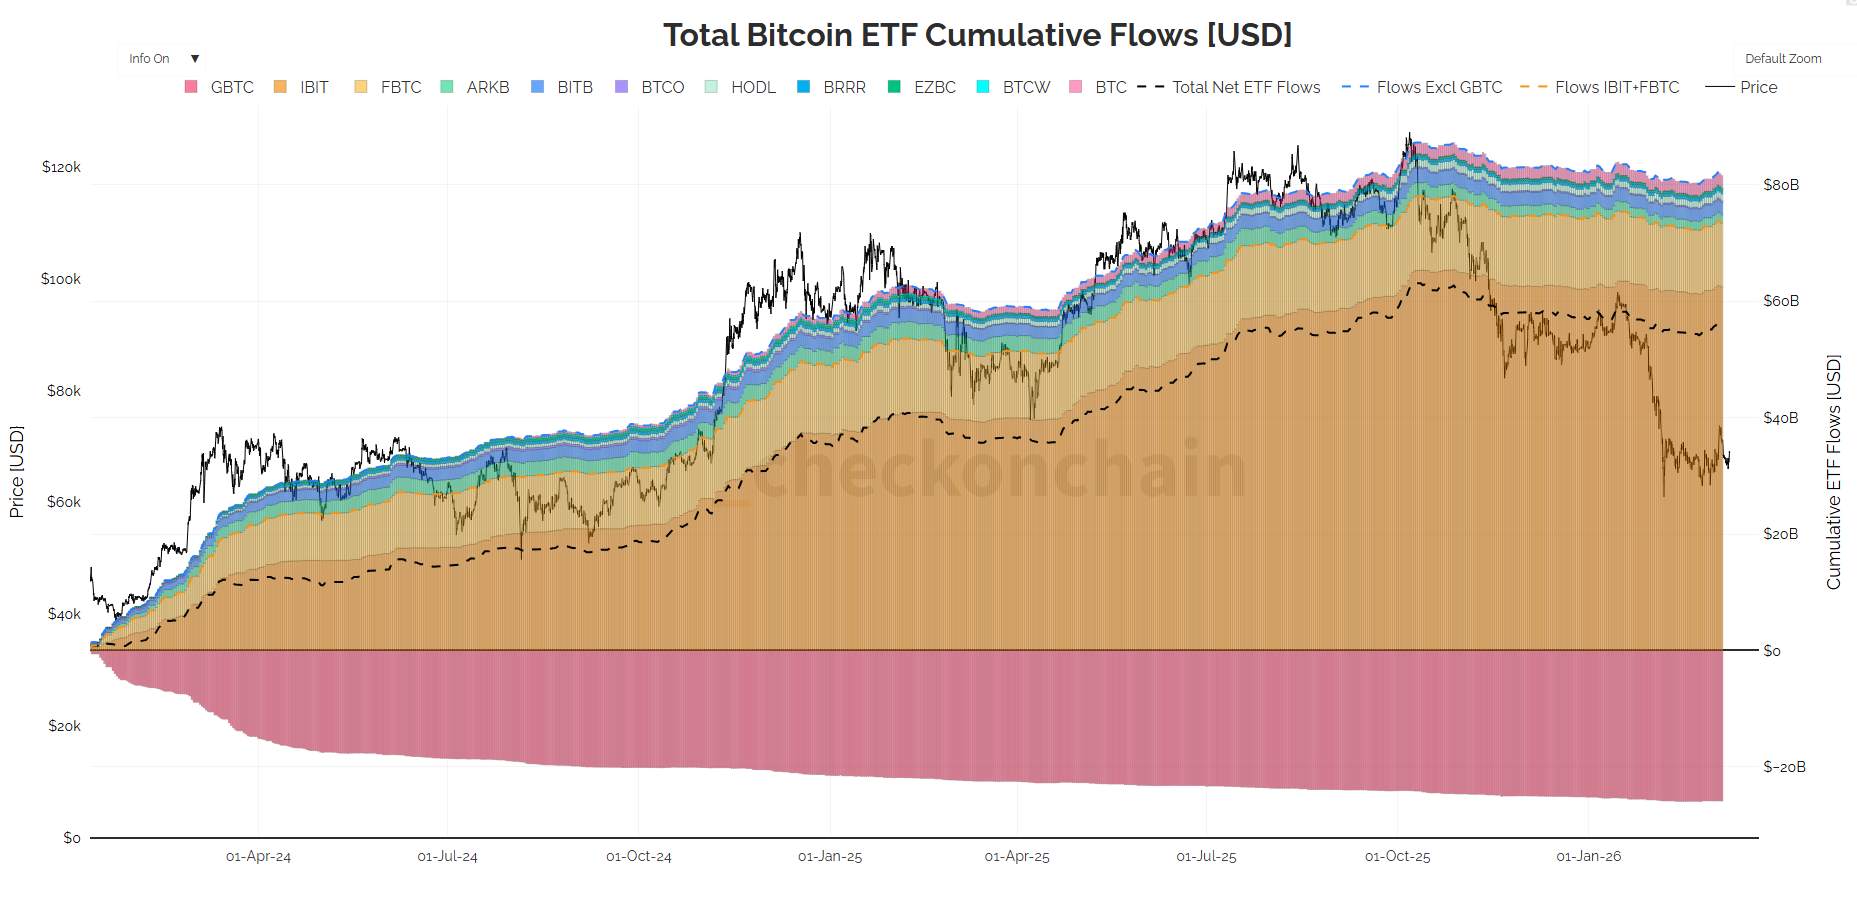
Early on, I speculated that ETF investors would prove to be stronger hands, and that appears to be the case. These investors are generally more sophisticated and are likely holding bitcoin as part of a broader portfolio strategy rather than trading it short-term.
The next chart comes from my old buddies at Bitcoin Magazine Pro, and it highlights something very interesting.
The red line shows the 28-day average ETF flow, while the blue line represents price. What stands out is the divergence: price accelerated lower into another leg down, but ETF outflows moderated significantly. They were much less negative.
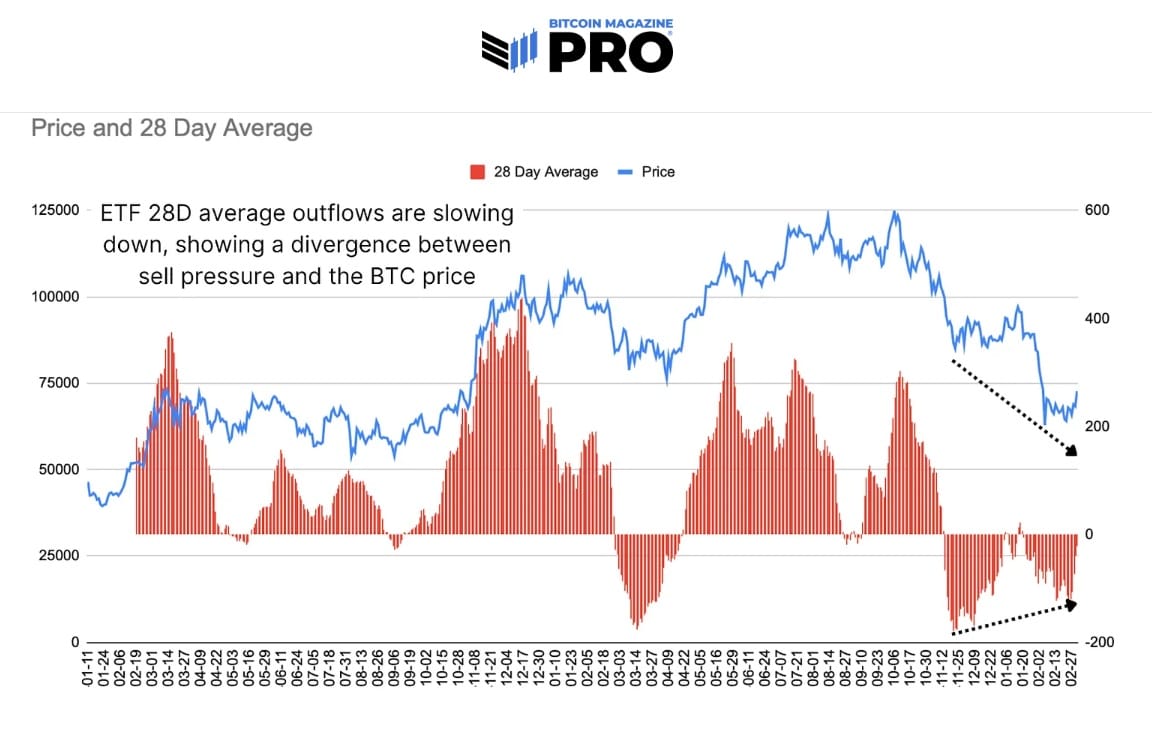
If we treat the 28-day flow trend as a momentum indicator, this represents a bullish divergence, and a strong one at that.
It’s been a tough six months for bitcoin, but I think that period is nearing an end. ETF flows held up beautifully during the first major stress test since launch. AUM remained relatively stable, and net flows are now signaling a potential shift in momentum.
HODL strong. Thanks for reading! PLEASE SHARE!
A
- Podcast links and Socials
- Disclaimer
- Feedback form
- Original charts and analysis are CC-BY