Macro Chart Rundown for 27.7.2021
Charts to keep you up-to-speed on what's happening in Macro. Today's post includes bitcoin, dollar, gold, oil, commodities, and inflation expectations.

If this is your first time reading a Macro Chart Rundown (I've usually published it over at BTCM.co, but I'm trying something new here), let’s quickly review the Bitcoin & Markets thesis in three parts - it might be something you aren’t used to.
- We had a 75-year credit expansion resulting in a global debt trap that will end in USD deflation, not inflation.
- This process coincides with the 4th Turning and a geopolitical reversal of the post-WWII US-led liberal trade order.
- Enter Bitcoin, a monetary alternative acting as a hedge against deflation and providing a new route to growth.
If you like this content, SUBSCIBE and SHARE with friends and family!
Let's jump into the charts.
Bitcoin
Bitcoin rallied hard yesterday. While some people attribute it to the fake Amazon news about accepting bitcoin on their platform, the charts had been approaching a decisive point for weeks. Hash rate is recovering, the network is stable, and the GBTC unlock of July 17th came and went. Uncertainty is waning and Bitcoin is ready to run. The scene had been set for any minor news event, like Amazon, to break the dam, allowing bitcoin to rise.
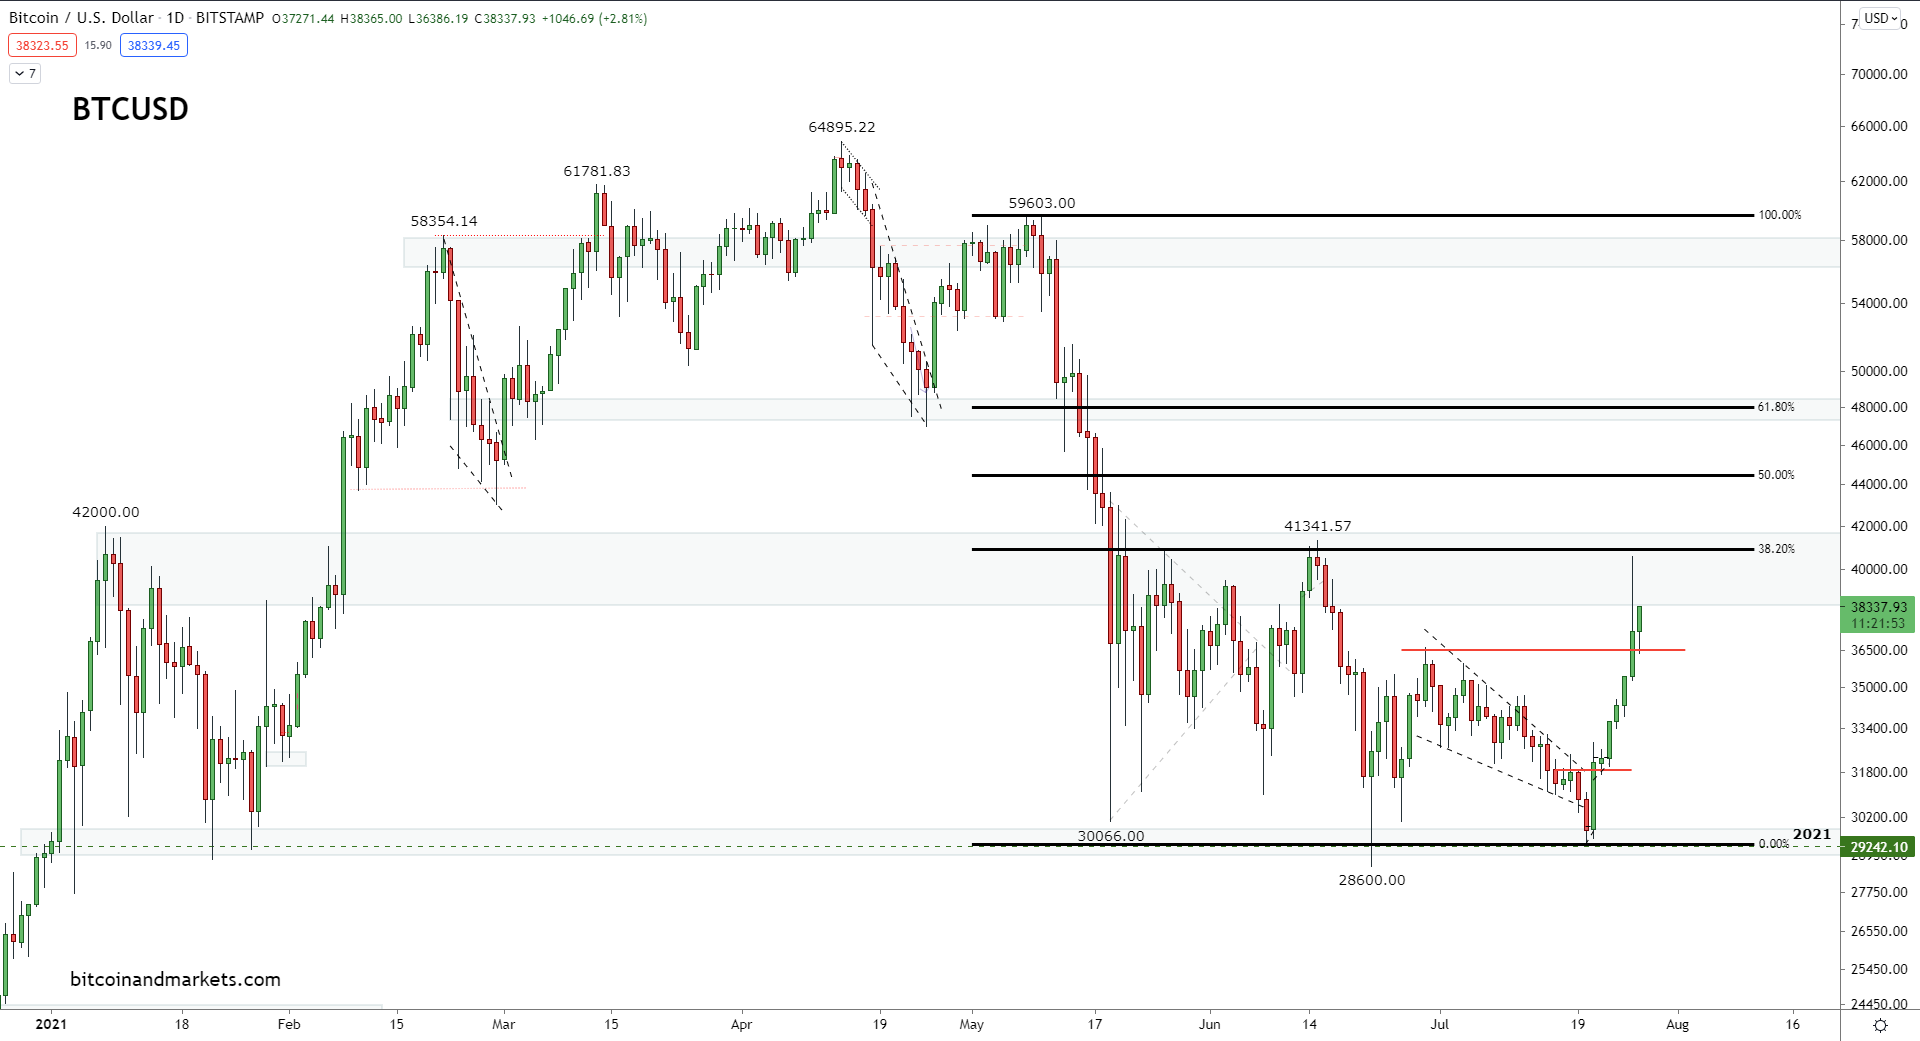
Price is currently in an area that has acted as resistance in the past. However, the momentum from the recent move is likely to break through and approach the next resistance zone of around $47,000. The sign that this is a bull trap will be not holding the $36,500 level. If there is a daily close below that, we could see a short term set back.
Dollar
If the theory of a tight dollar and Bitcoin as a deflation hedge is correct, we should expect the dollar and bitcoin to be positively correlated.
As it turns out, we do see this correlation over a long-term timeframe. Take the last decade, the dollar index and bitcoin have risen together. Sure, there are some periods of inverse correlation because bitcoin is in its own world most of the time, but the long-term macro correlation is there.
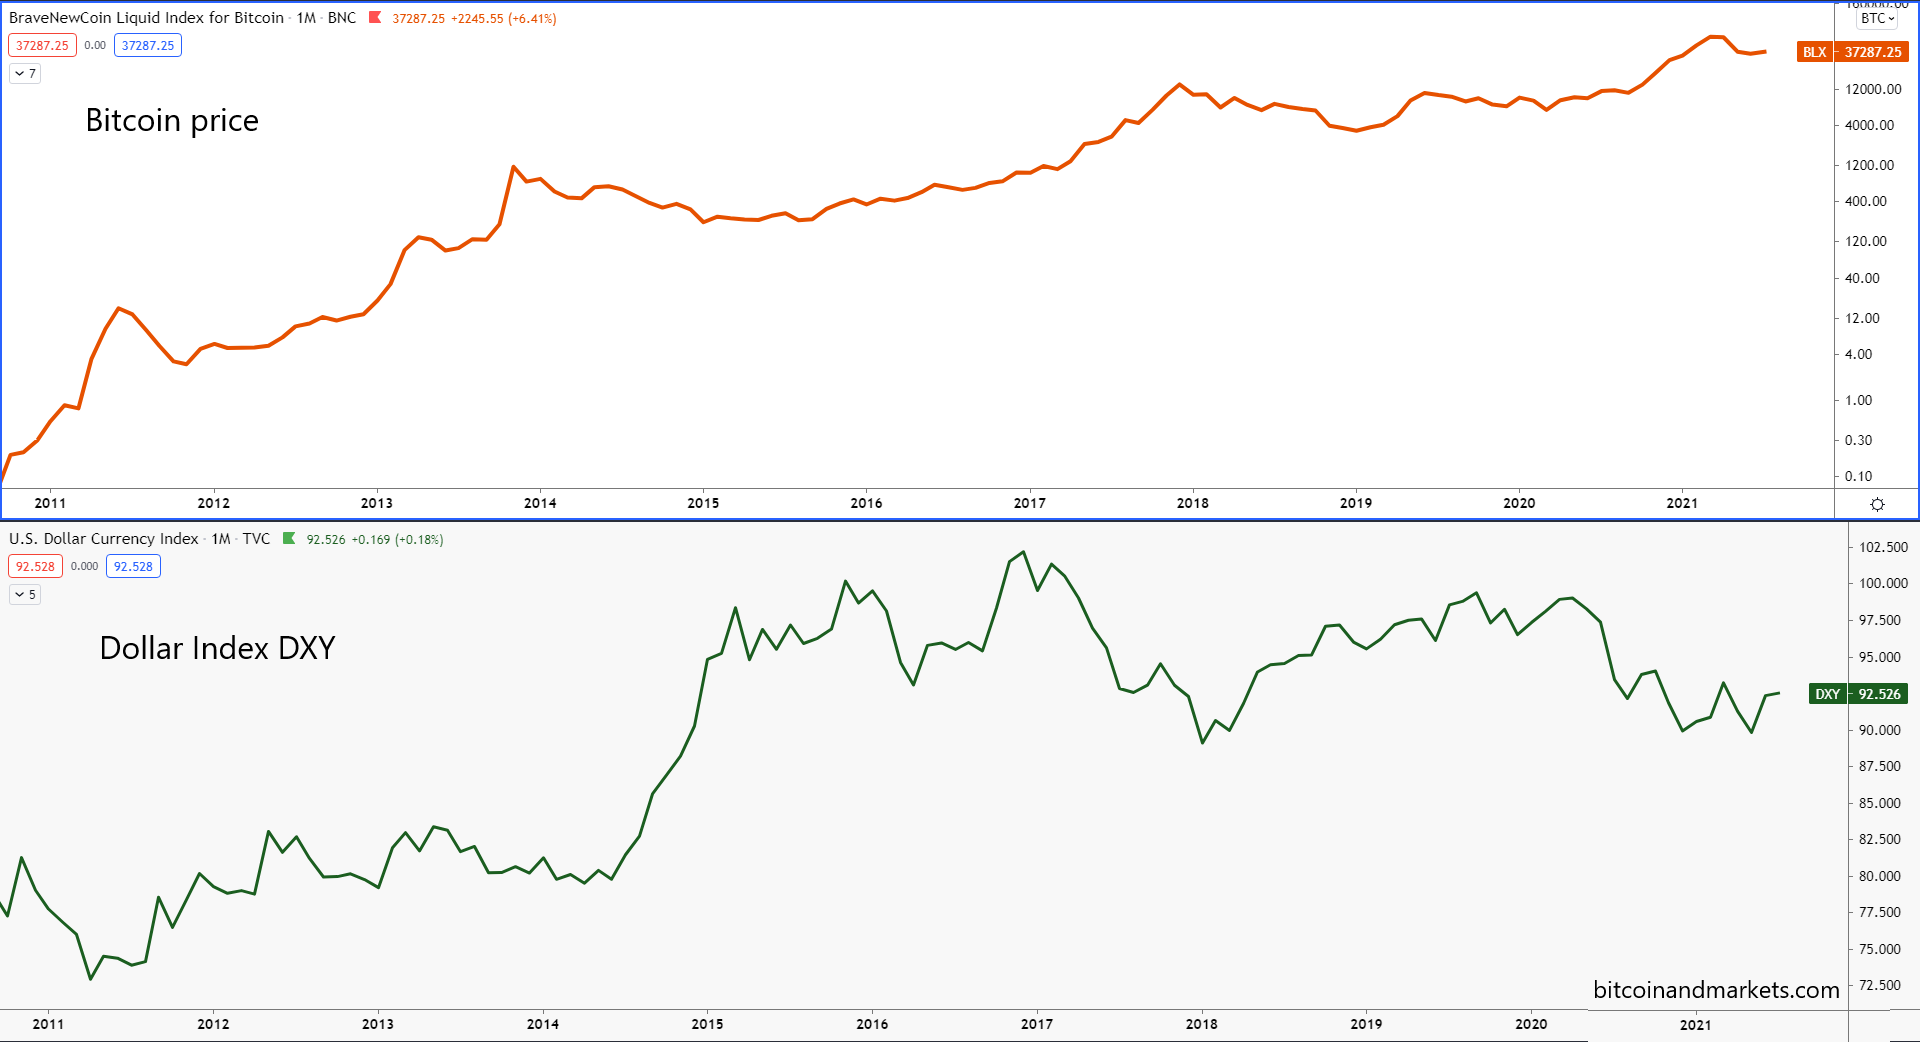
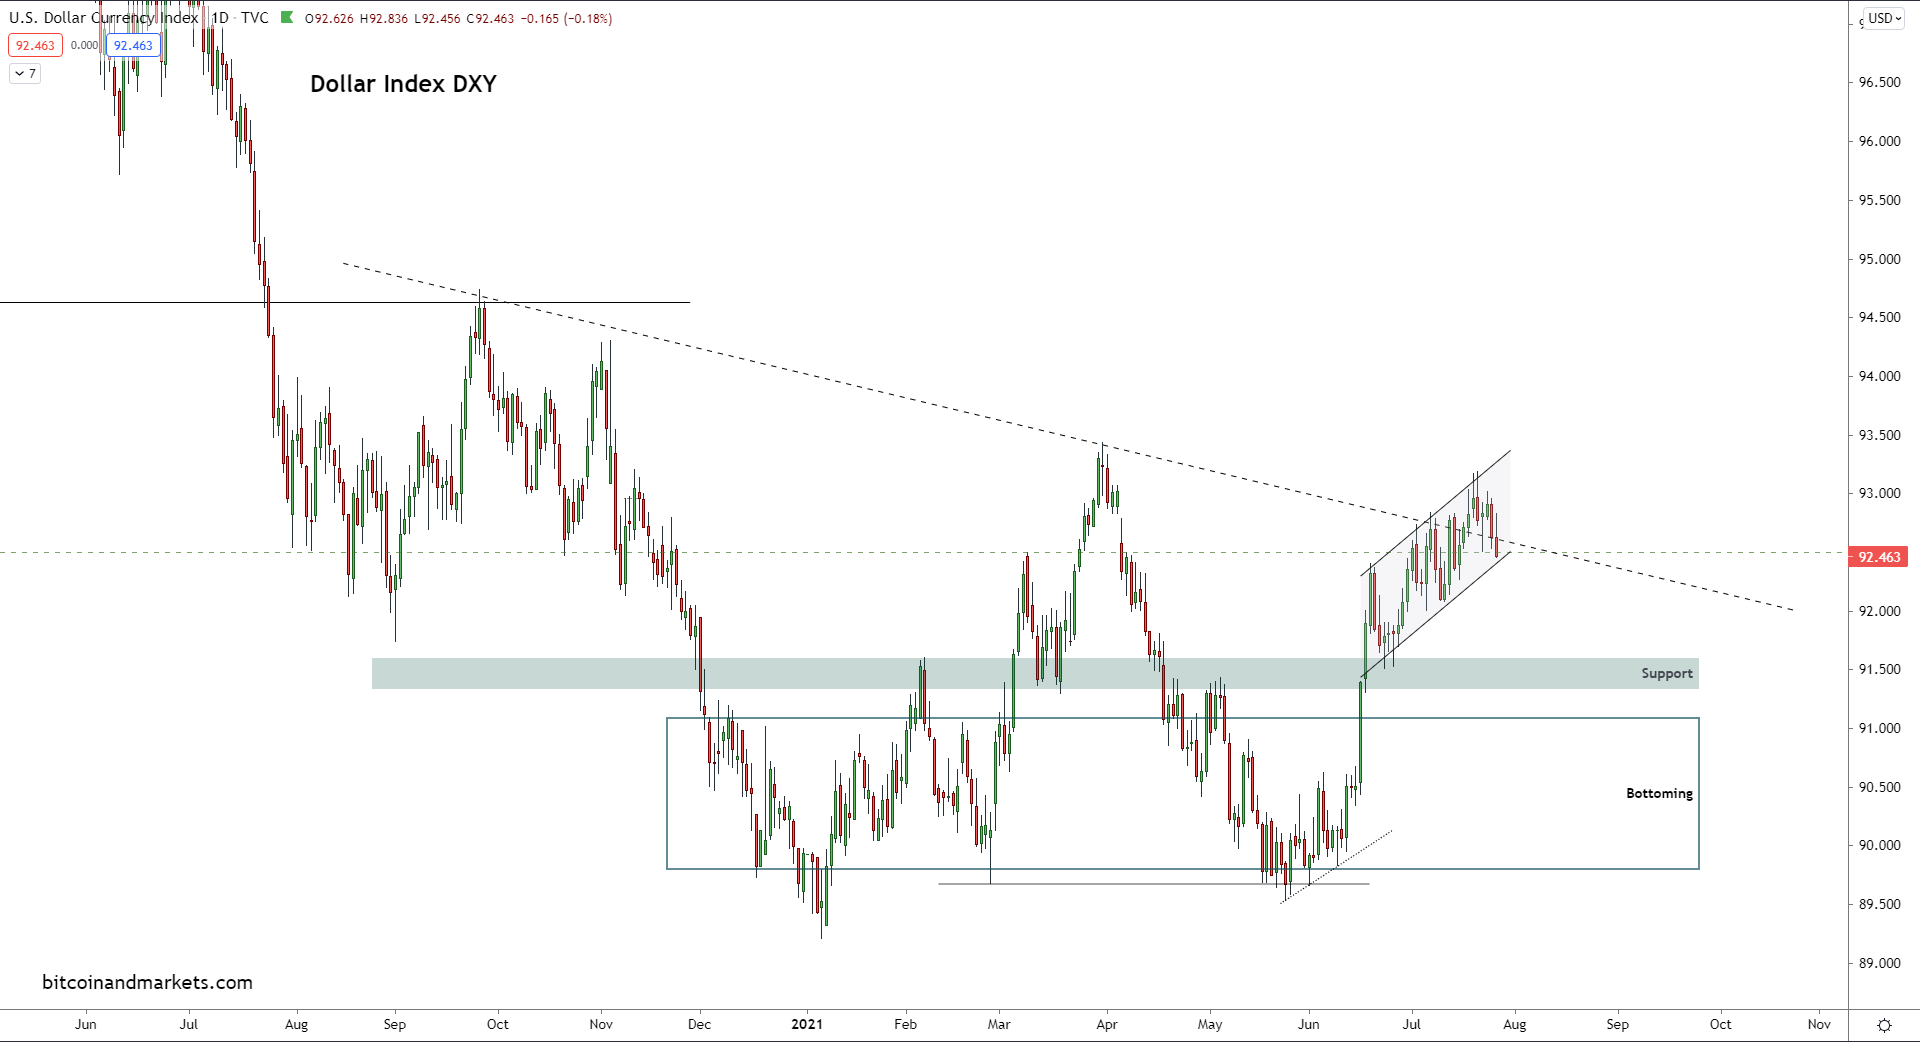
Most recently, the dollar held the 2018 low and is starting to rally; Bitcoin also hit a recent bottom of $28,000 which is much higher than its lows in 2018 and 2020.
Even with the QEs from the Fed highlighted, it is hard to identify any dollar weakening at all. In fact, other than the QE 1, each successive effort has started at a higher level for the DXY.
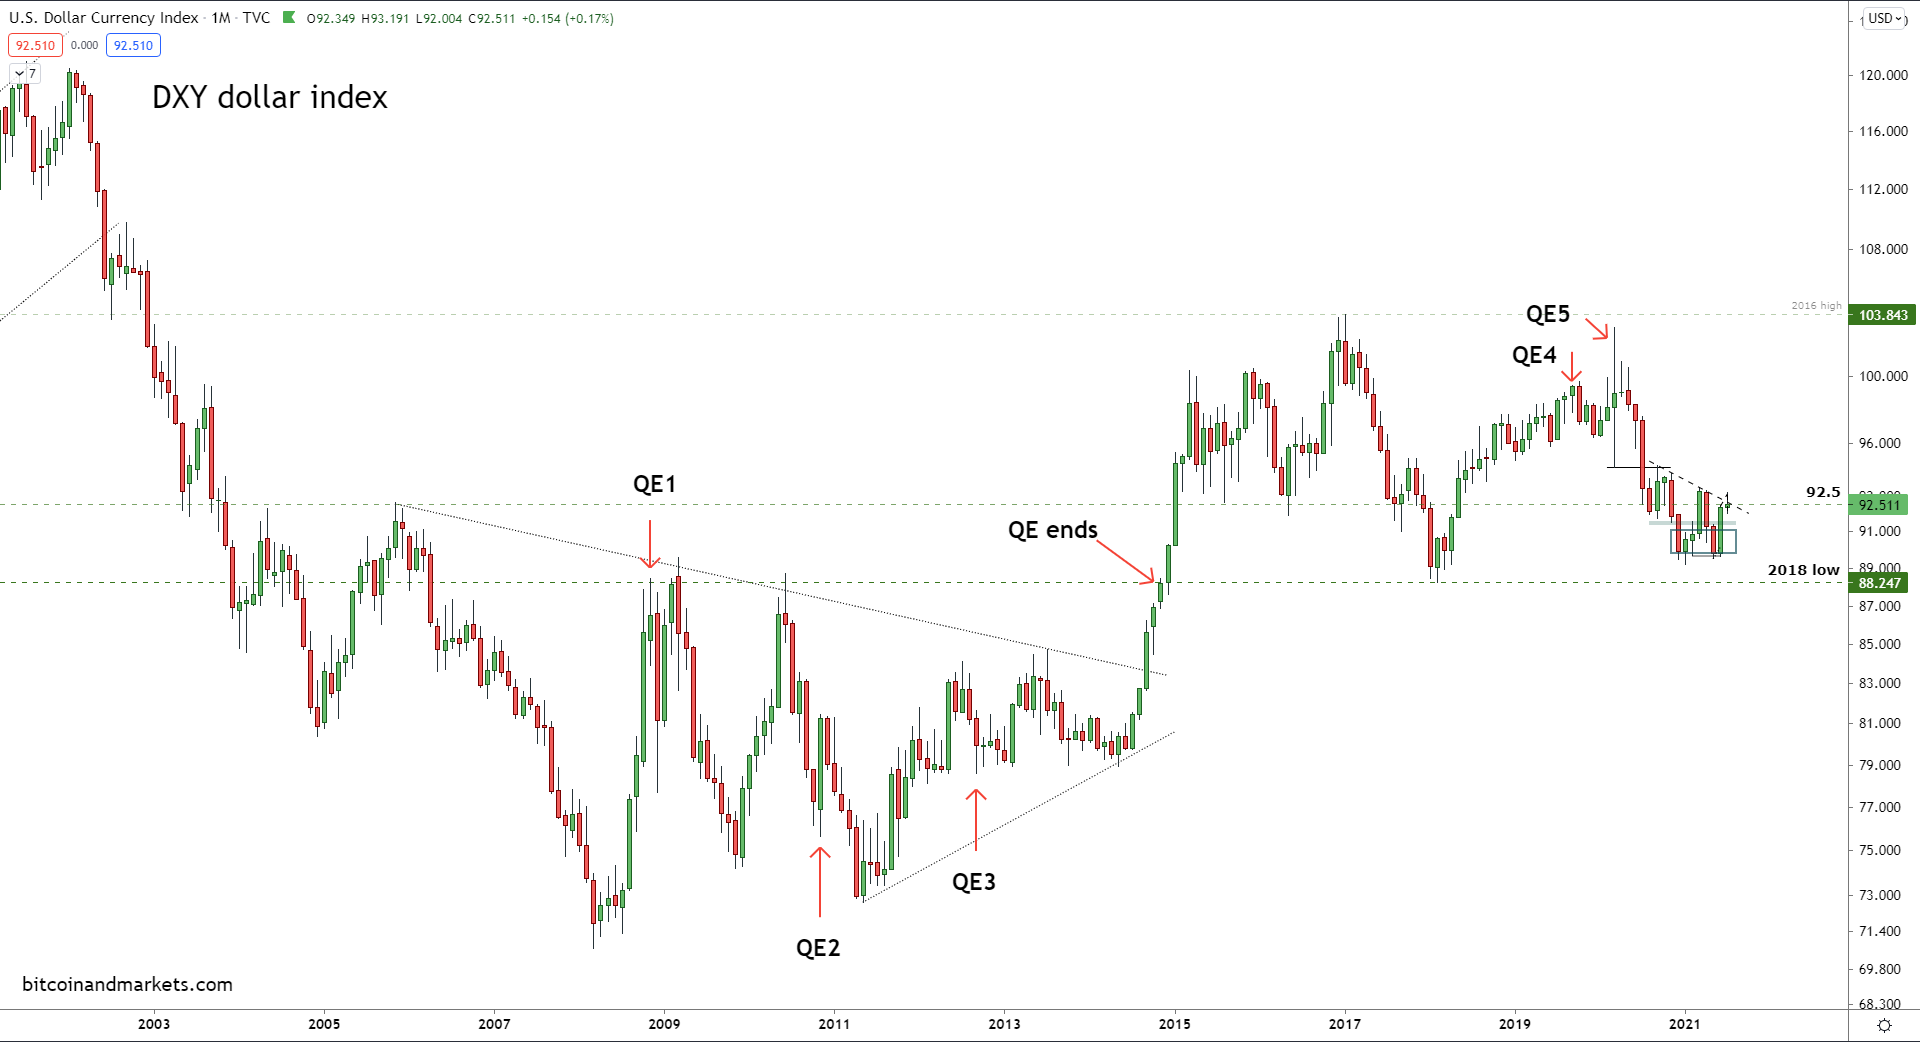
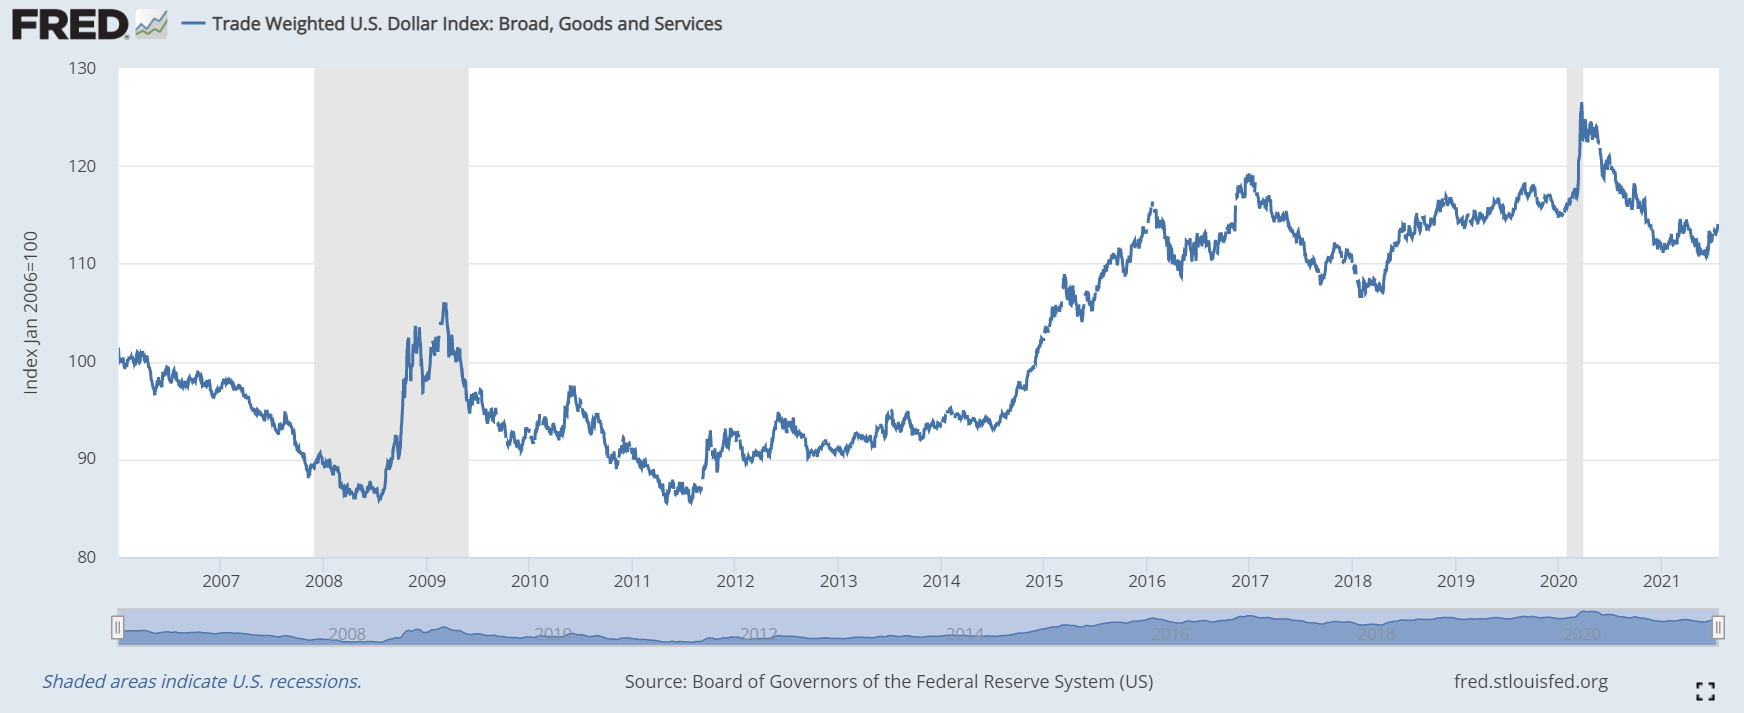
The decade-long trend of a strengthening dollar is yet more apparent on the trade-weighted dollar index.
Overall, the dollar looks healthy and strong in the forex markets. If dollar scarcity becomes acute in foreign markets, which we expect over the next 6 -12 months, or issues arise in the reverse repo market, the DXY can strengthen quickly. Of note, the slow motion breakout in the dollar is happening at the same time as this breakout in bitcoin, because bitcoin offers potential growth in a world of deflationary pressures.
Gold
A person expecting inflation might say, "but you are measuring the dollar against other fiats which are all losing value in a race to the bottom!" Okay, let's look at gold and commodities then.
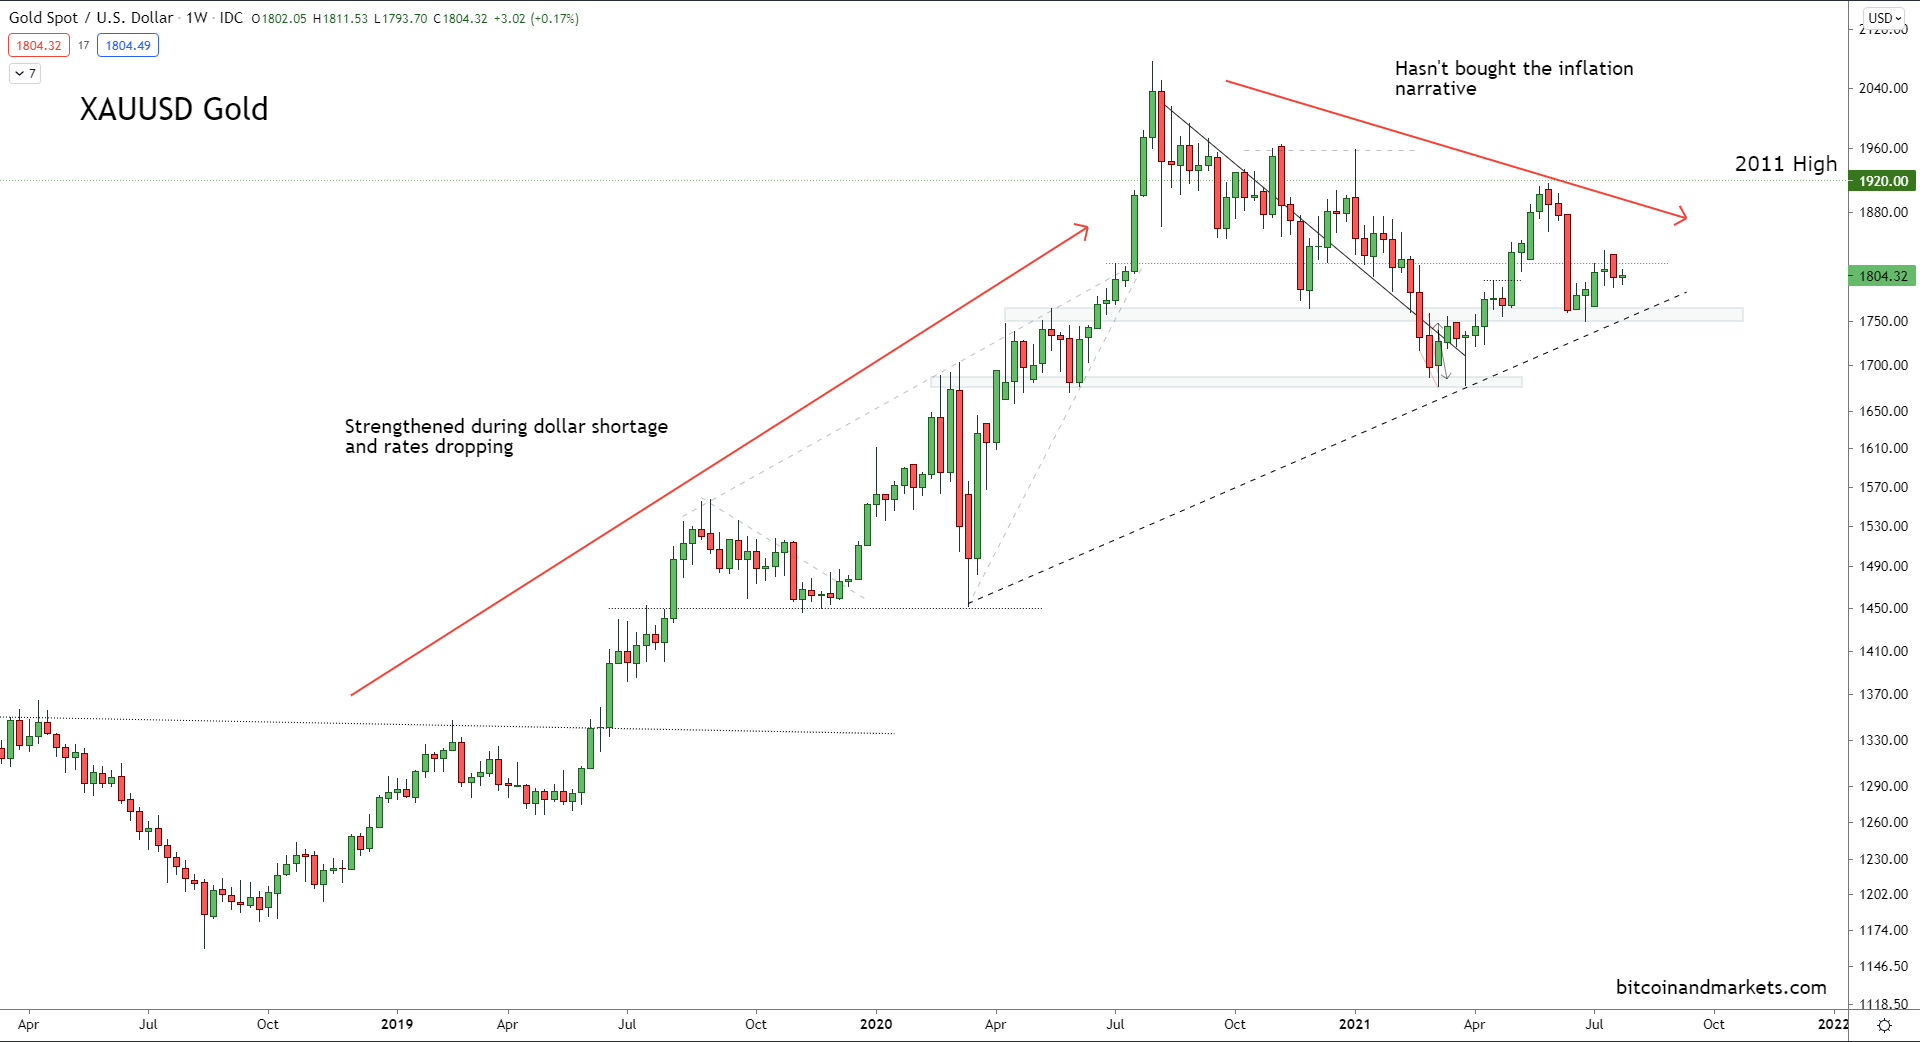
Gold strengthened with the dollar starting in late 2018, as US Treasuries rallied and rates fell. After a blow-off top in gold, only marginally above its 2011 ATH, gold stopped believing in the inflationary narrative and started to drop. This fall coincided with the temporary reprieve in dollar tightness and a weakening of the dollar. Today, gold sits 7% below that high mark set ten years ago, back in 2011.
My 2021 forecast for gold was a bearish H1, followed by a strong H2. I maintain this call. When I say strong though, I don’t mean strength like bitcoin. Perhaps gold can gain 10-20%, putting in a new ATH.
I expect gold and the dollar to strengthen together, for the same reason the dollar and bitcoin will strengthen together. Low interest rates signify tight economic conditions, banks don't want to lend and there's no yield anywhere. Investors are looking for the lowest risk collateral they can get.
Gold was also recently added to Basel III regulations for international banks as a “zero-risk asset” when held in allocated, tangible form, according to Market Watch. This should provide incentive for banks currently participating in reverse repo with the Fed, to diversify marginally into gold.
Oil
Oil is the most-traded commodity in the world. It is extremely liquid and difficult to manipulate. After the devastating negative futures price in April 2020, which caused widespread damage to the industry, price has been defying gravity, hitting as high as $76.95 / bbl on July 6th. This monster rally is not, however, a sign of inflation. It is a sign of the damage caused to the industry in 2020. The fact is, oil has struggled to recover to the 2018 high and was swiftly rejected, similar to how the dollar neared the 2018 low and bottomed.
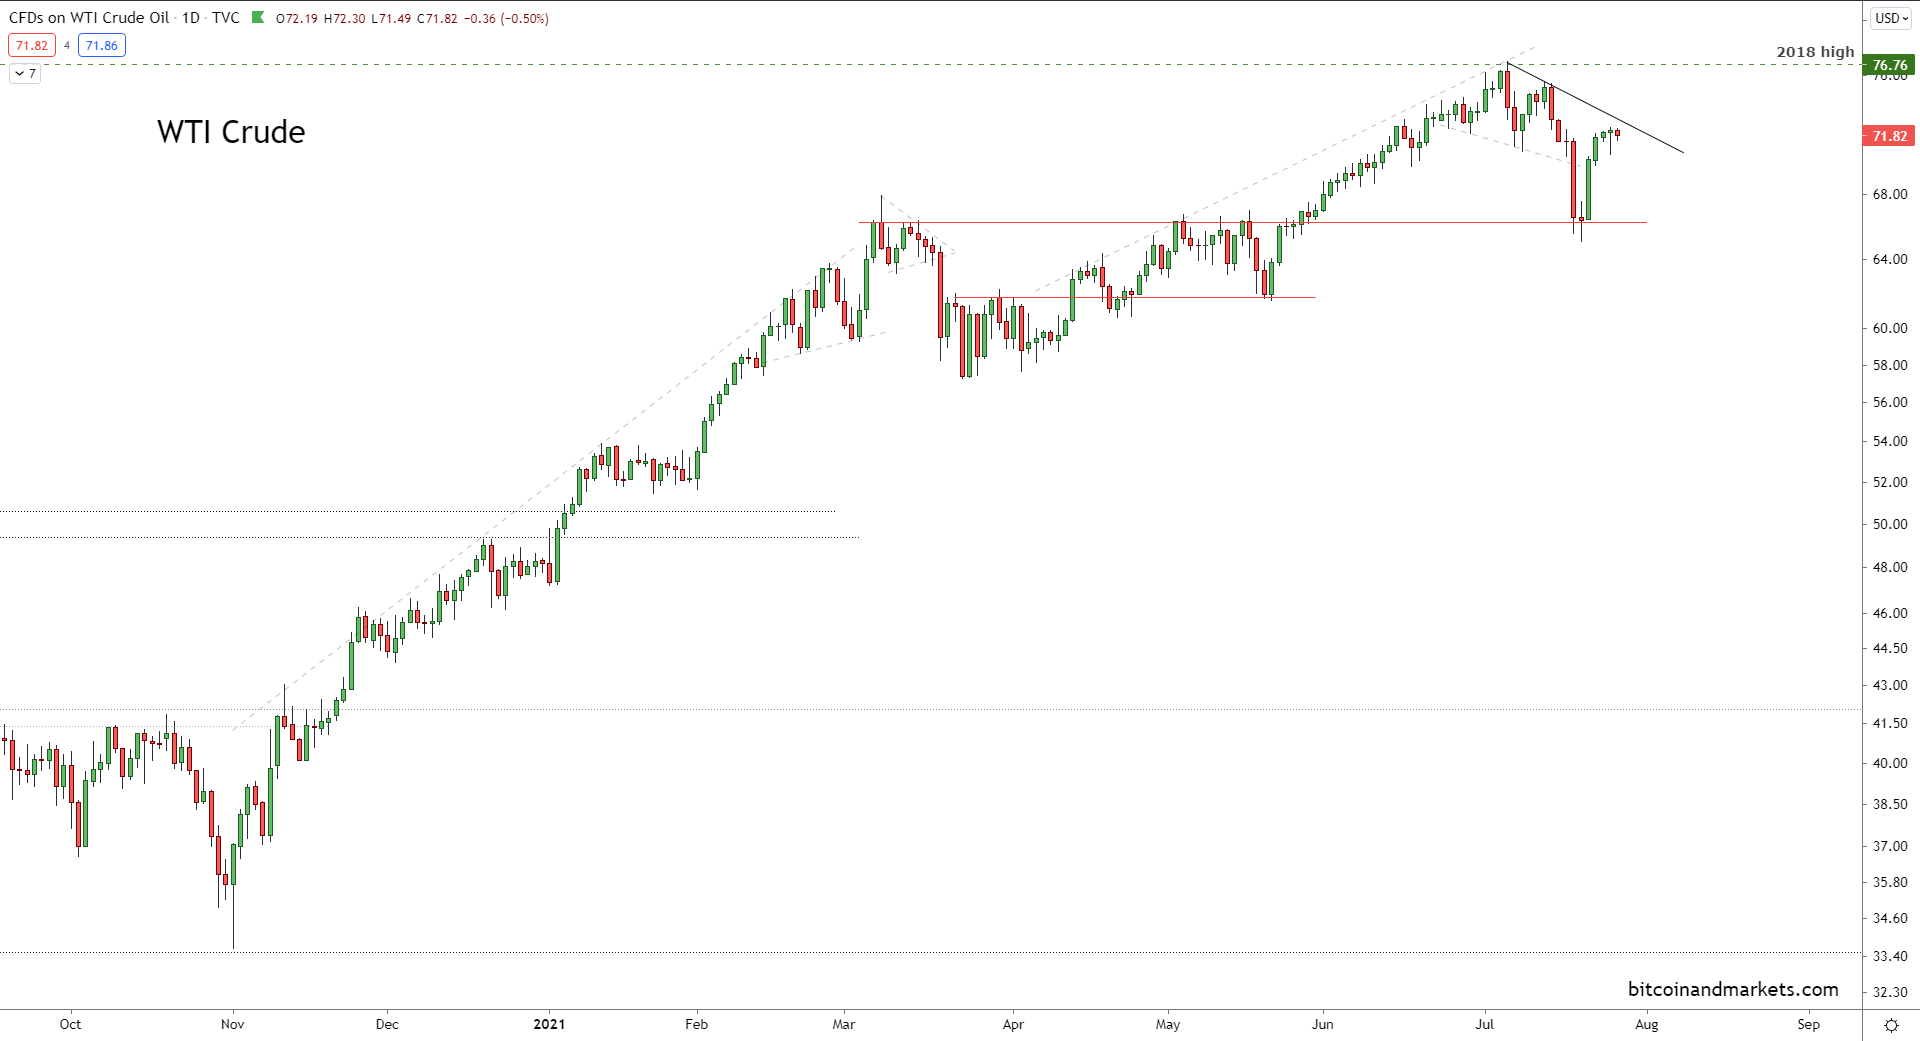
The fundamentals behind oil are lower than expected global demand and an increase in supply. People expected the reopening recovery to continue to accelerate, but now it appears stalled. As the oil industry forecasts 12 months into the future, they don’t see that huge reflationary demand anymore.
At the same time, US capacity is slowly coming back online. The average breakeven for shale is less than $60 / bbl according to an April ‘21 article by Tsvetana Paraskova of OilPrice.com, and oil production in the US (the world’s largest oil producer) is finally closing the production slack.
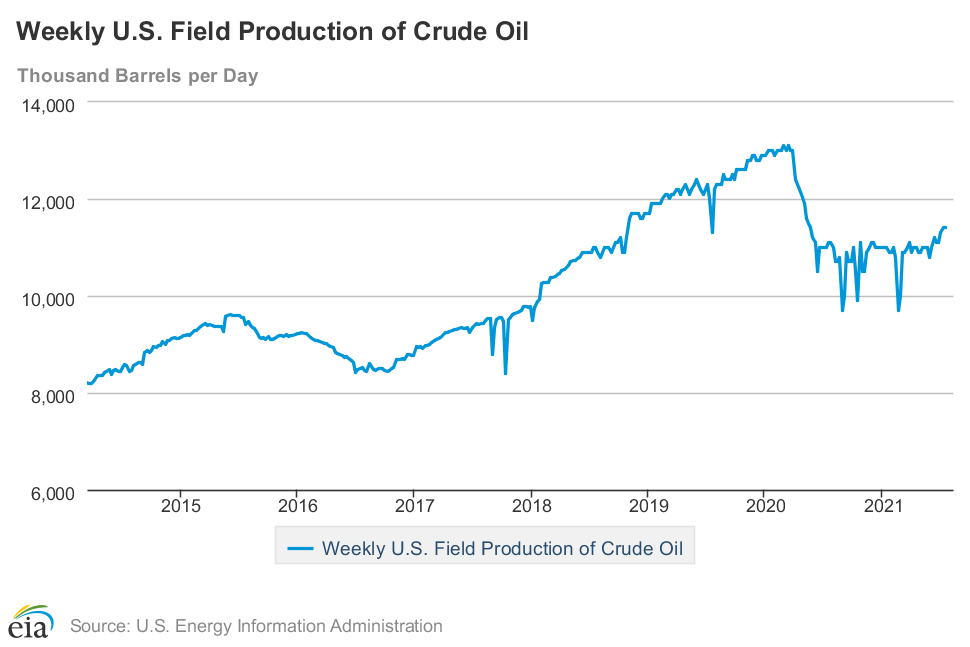
In addition, OPEC recently agreed to phase out 5.8 million barrels per day in cuts according to Investors Business Daily, meaning they are also going to be closing their self-imposed production slack.
For these reasons, oil prices will find it hard to continue going up, and we will most likely see prices slowly retrace into the $50s/bbl range. That, my friends, is not inflationary.
Commodities
Next, on this Macro Chart Rundown, let’s take a look at the commodities index. If we are entering a secular bull market in commodities due to inflation, we would expect these indices to be breaking important levels. Why is the bear trend still intact?
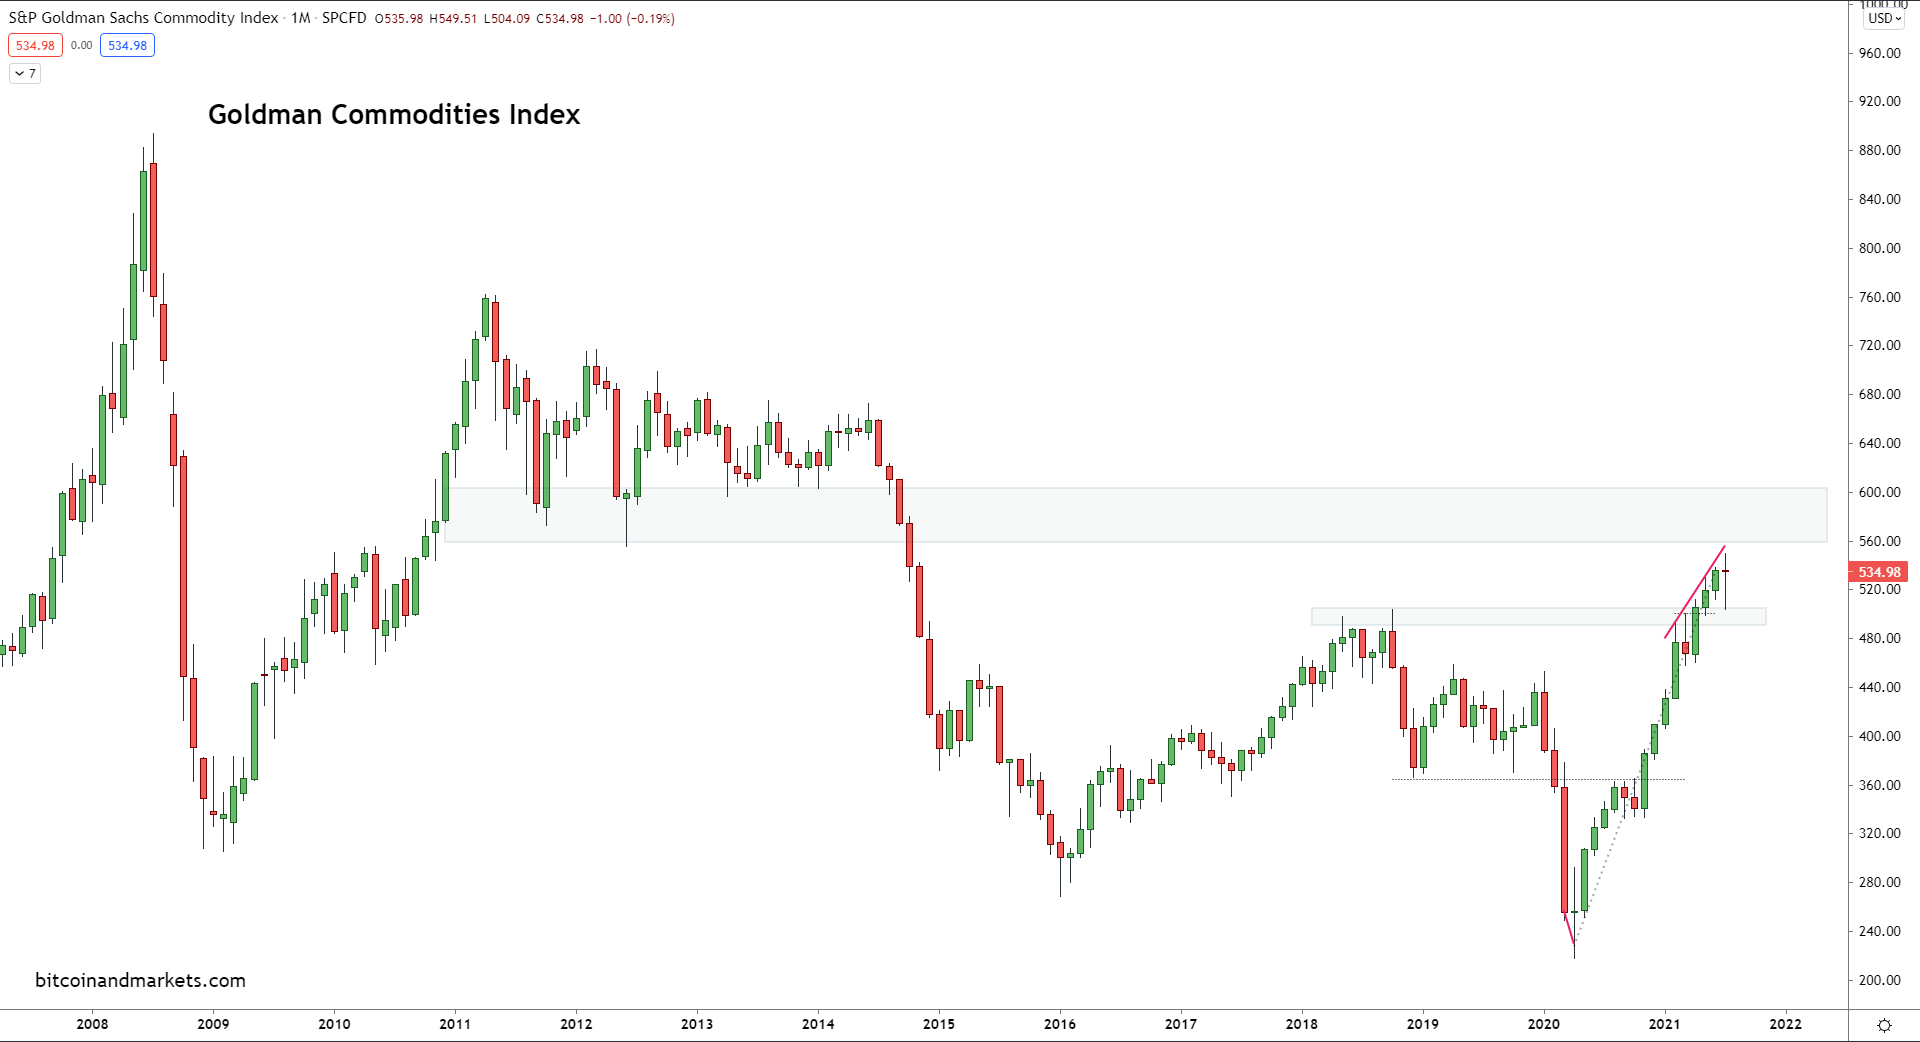
The monthly chart shows the recent year-long rally losing steam, long before doing any significant damage to the chart. Lumber has absolutely crashed, copper is copy & pasting from the Great Financial Crisis, recently peaking, and we haven’t even touched on the slowdown in the world’s largest commodities consumer, China. We should expect commodity prices to come down for the rest of the year.
Inflation Expectations
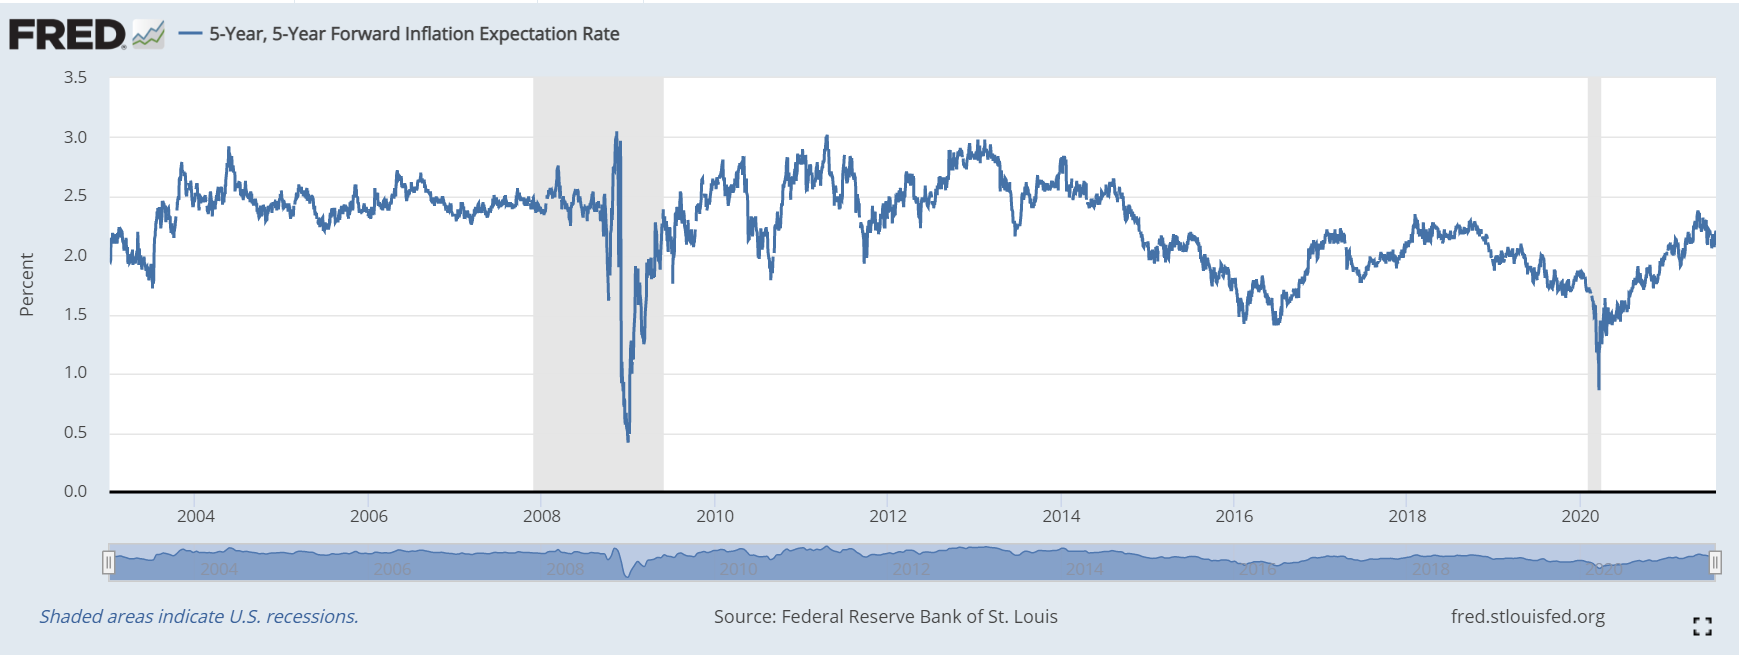
Lastly, to round-out this update, we take a look at inflation expectations. The 5y5y Forward is your standard inflation expectation measure for the economy, that’s from people with skin in the game. As you can see, inflation expectation never reached levels that prevailed prior to the Great Financial Crisis or in the year immediately after. The story directly from the market is that there is no runaway inflation in sight. The recent peak was 2.38% and headed down.
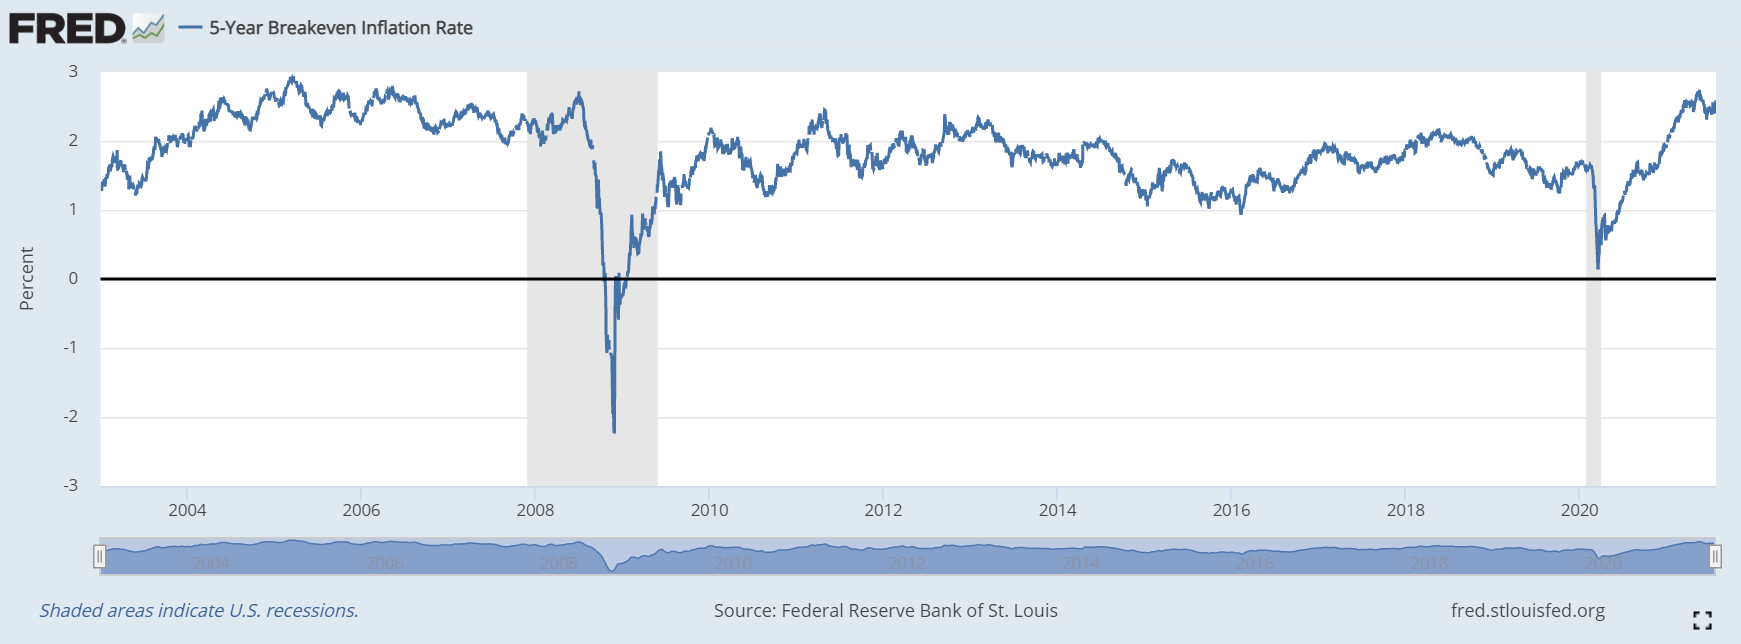
The 5y Breakeven is also down from its recent peak of 2.72%, but it did get closer to the pre-GFC normal. Still very far from runaway inflation.
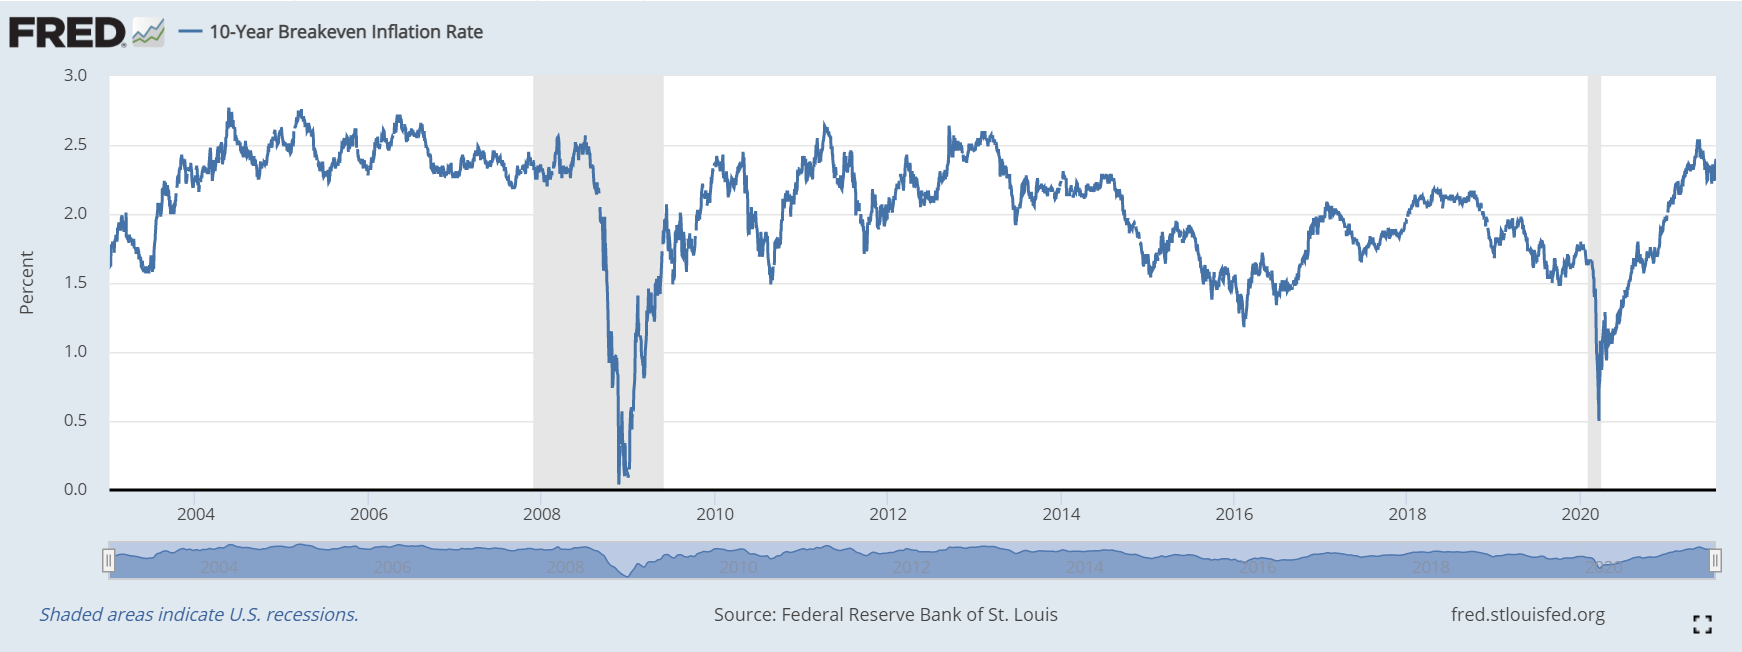
And the 10Y Breakeven tells a similar story, a peak of 2.52%.
Conclusion
Deflationary pressures are growing. The macro outlook for the second half of the year is a slowing global economy, slowing inflation, and the resurgence of a strong dollar environment. Contrary to popular belief, this is bullish for bitcoin, as people search for growth and yield. As bitcoin’s superior Number go Up (NgU) technology approaches the second half of this bull market cycle, investors will be eager to get exposure.
Bitcoin provides the world with an alternative monetary system as the dollar system dies. That death will not be an inflationary boom. As collateral and dollar shortages continue to wreak havoc via deflationary pressure, the bitcoin ecosystem will expand, giving people an alternative path back to growth.