Bitcoin Pulse #121
In this issue: Bitcoin price analysis in 8 charts - Fractals, moving averages, cycle timing, divergences, bollinger bands

ISSUE #121 | Nov 18, 2021 | Ansel Lindner | Disclaimer
In this issue:
- Bitcoin price analysis in 8 charts
- Fractals, moving averages, cycle timing, divergences, bollinger bands
The Bitcoin Dictionary is LIVE on Amazon!
Where else to find me : Fed Watch podcast | BTCM Research blog
Bitcoin Price * |
$58,030 (-$2,416, -4.00%) |
Short term outlook (BMI) |
0 : Neutral |
Hello members,
Along with the bitcoin analysis included here, some macro developments need attention. I'll be covering that in the next week, not sure if on this blog or Bitcoin Magazine, because they showed interest in my last issue of the Macro Rundown. Anyway, stay tuned for that.
Also, a reminder that Bitcoin Vital Signs, where I check out all the network fundamentals and relay my key takeaways has been broken out into its own post. I should be able to get to that this weekend.
Enough admin notes. Thanks for you support. Let's dive in.
Bitcoin Price Analysis
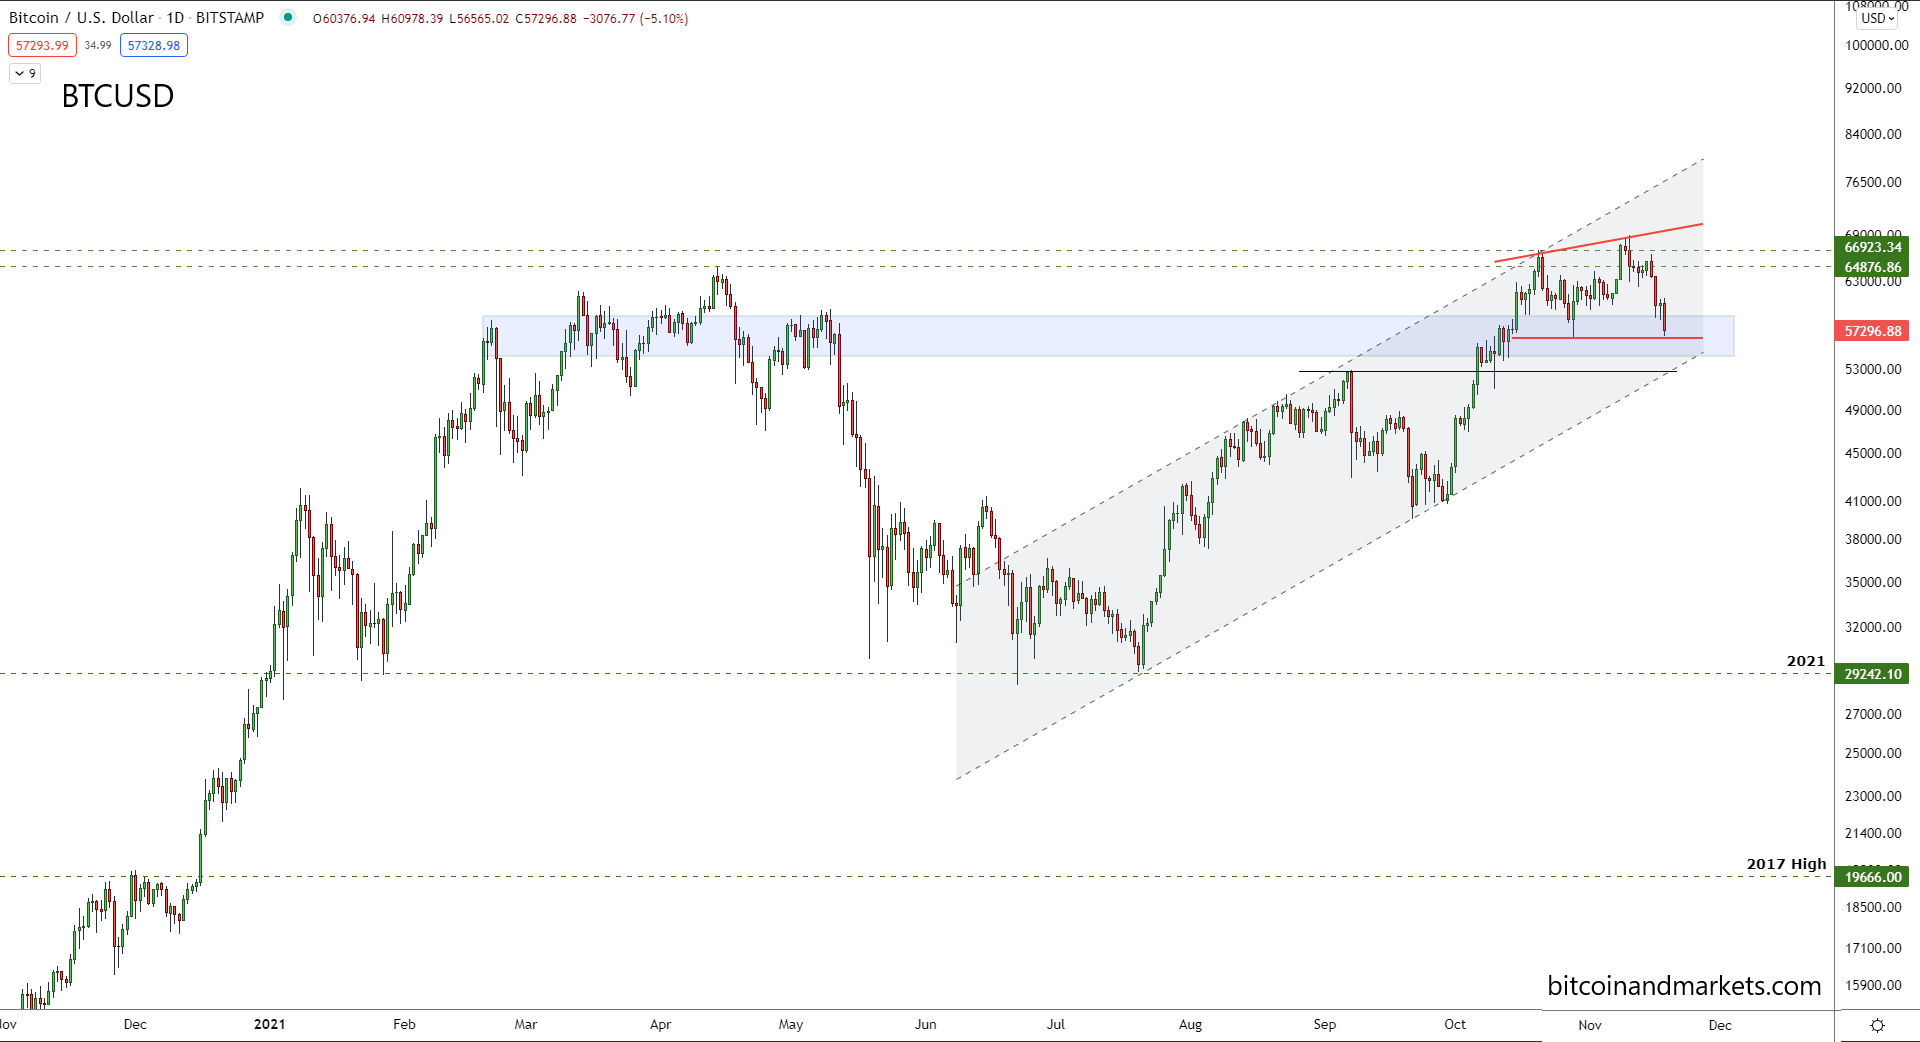
Price has been obeying the channel I identified on last issue. It is also holding strong on support. At this point, it's not quite time to get worried about near-term price until we take a little deeper look.
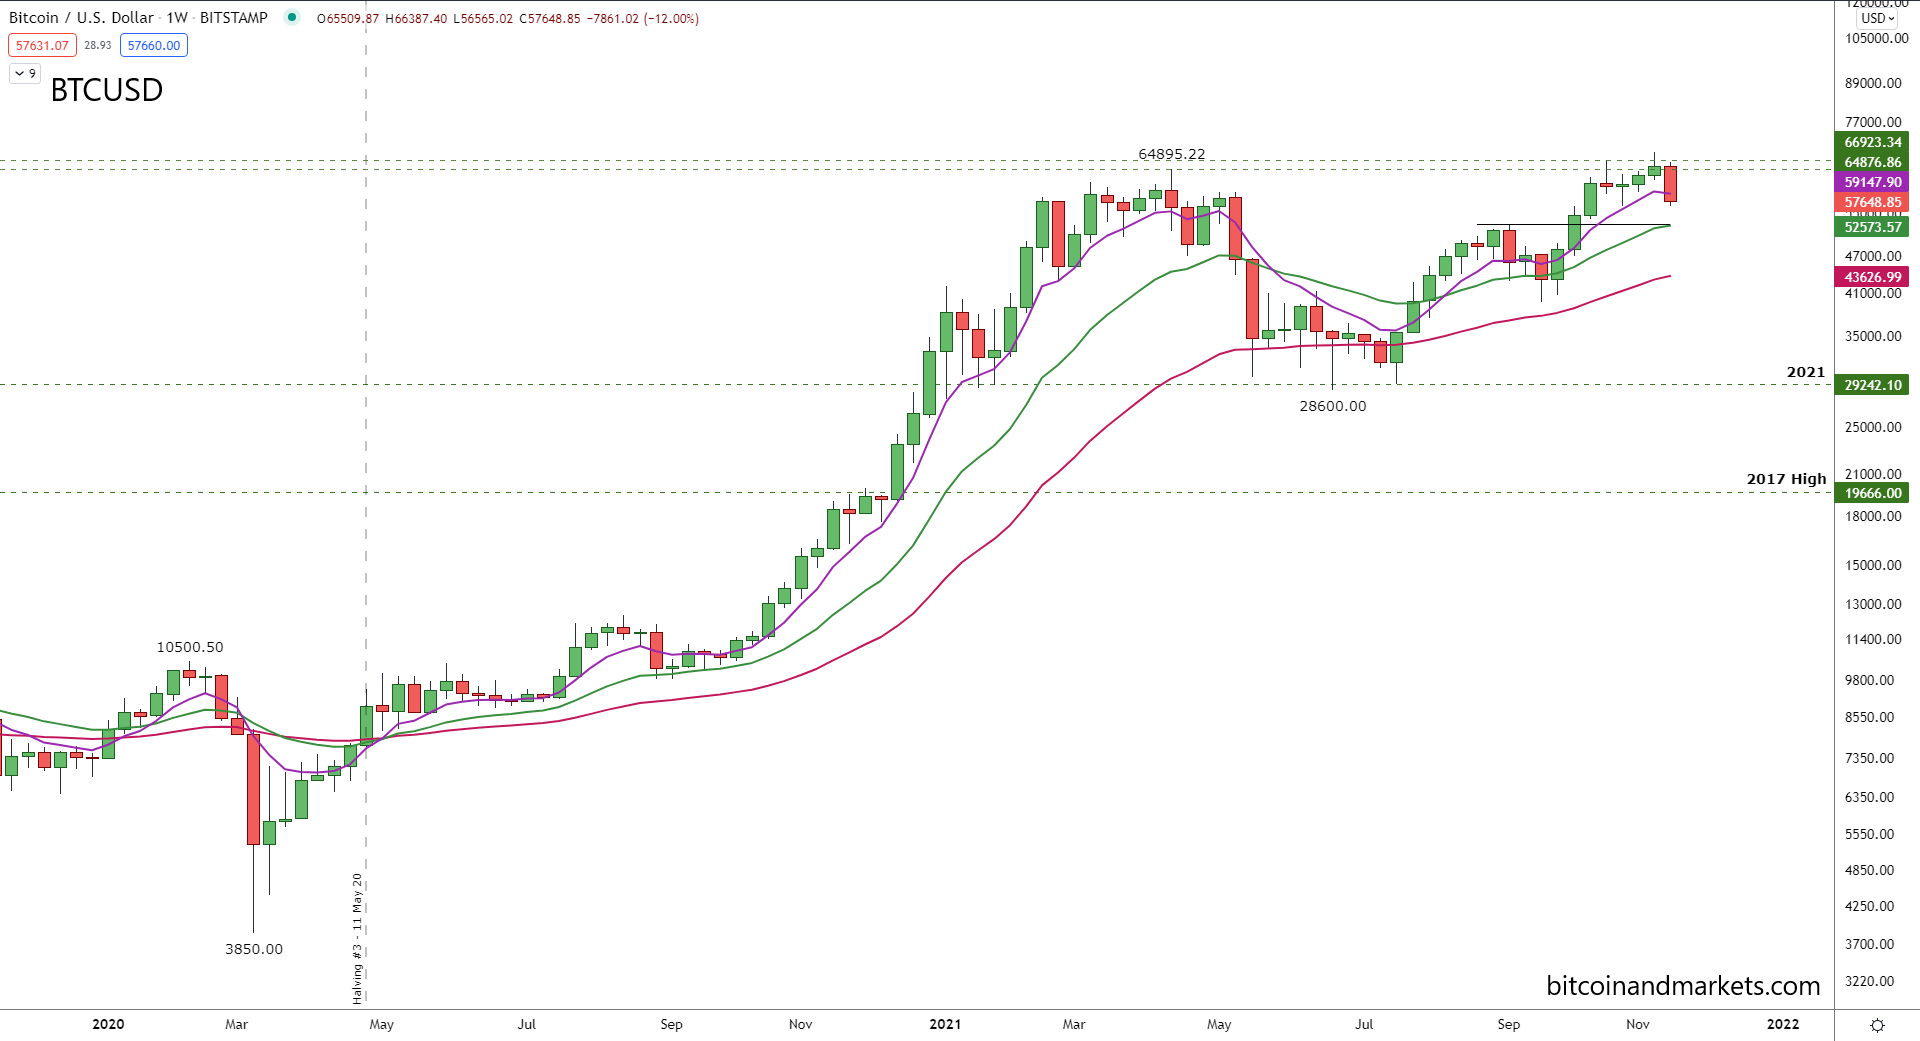
Moving Averages
On the weekly trend we can see price is currently below the 7-period EMA, which doesn't tend to break if near-term price is bullish. You can see below that during the previous rally, price didn't close below the 7-week EMA from October 2020 to April 2021. This break of the 7 EMA is more like the break prior to Oct 2020 than at the end of the insane rally. We should next be eyeing the 20 EMA which is currently $52.5k.
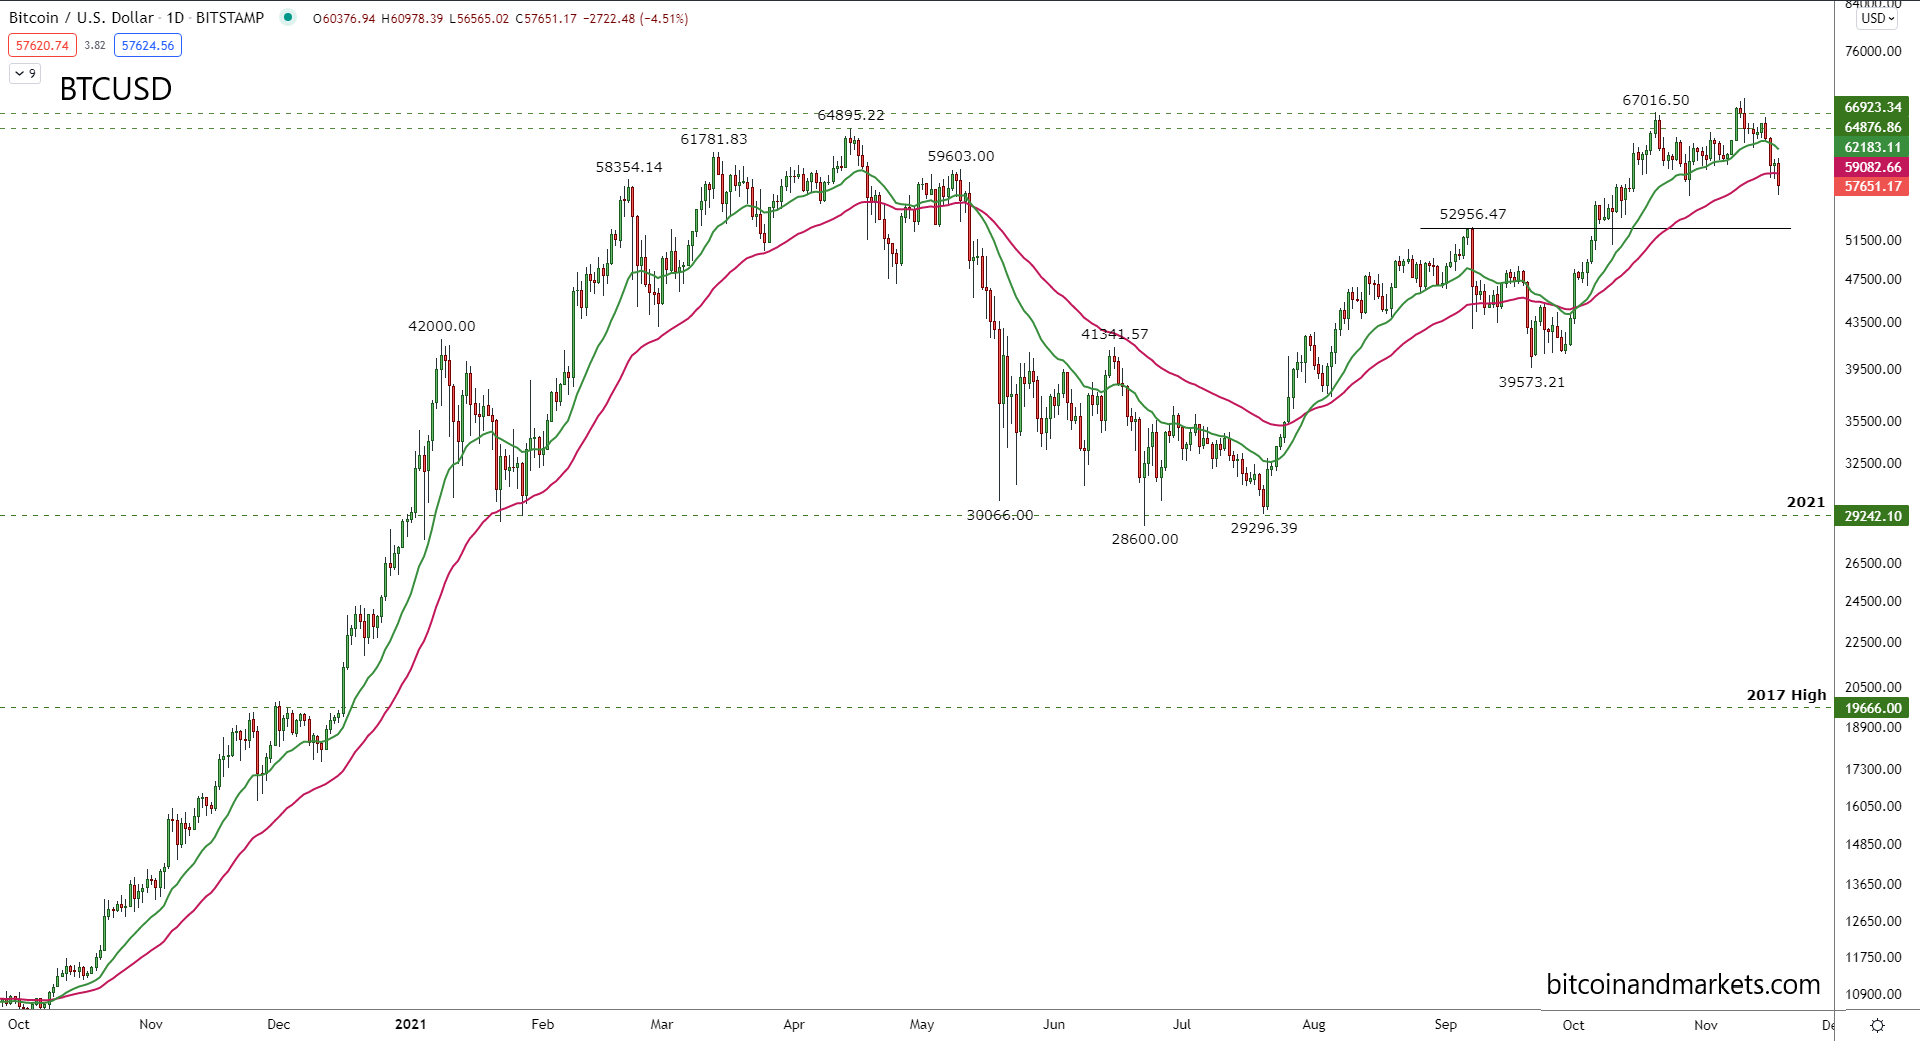
Daily moving averages you can see that the 20 EMA (green) is generally respected on a bullish move, and the 50 EMA (pink) is usually tested as the move is petering out. Price has broken both, and though that is a sign that we are not in for immediate more upside, it doesn't mean a further breakdown is imminent either. Overall, this is saying sideways.
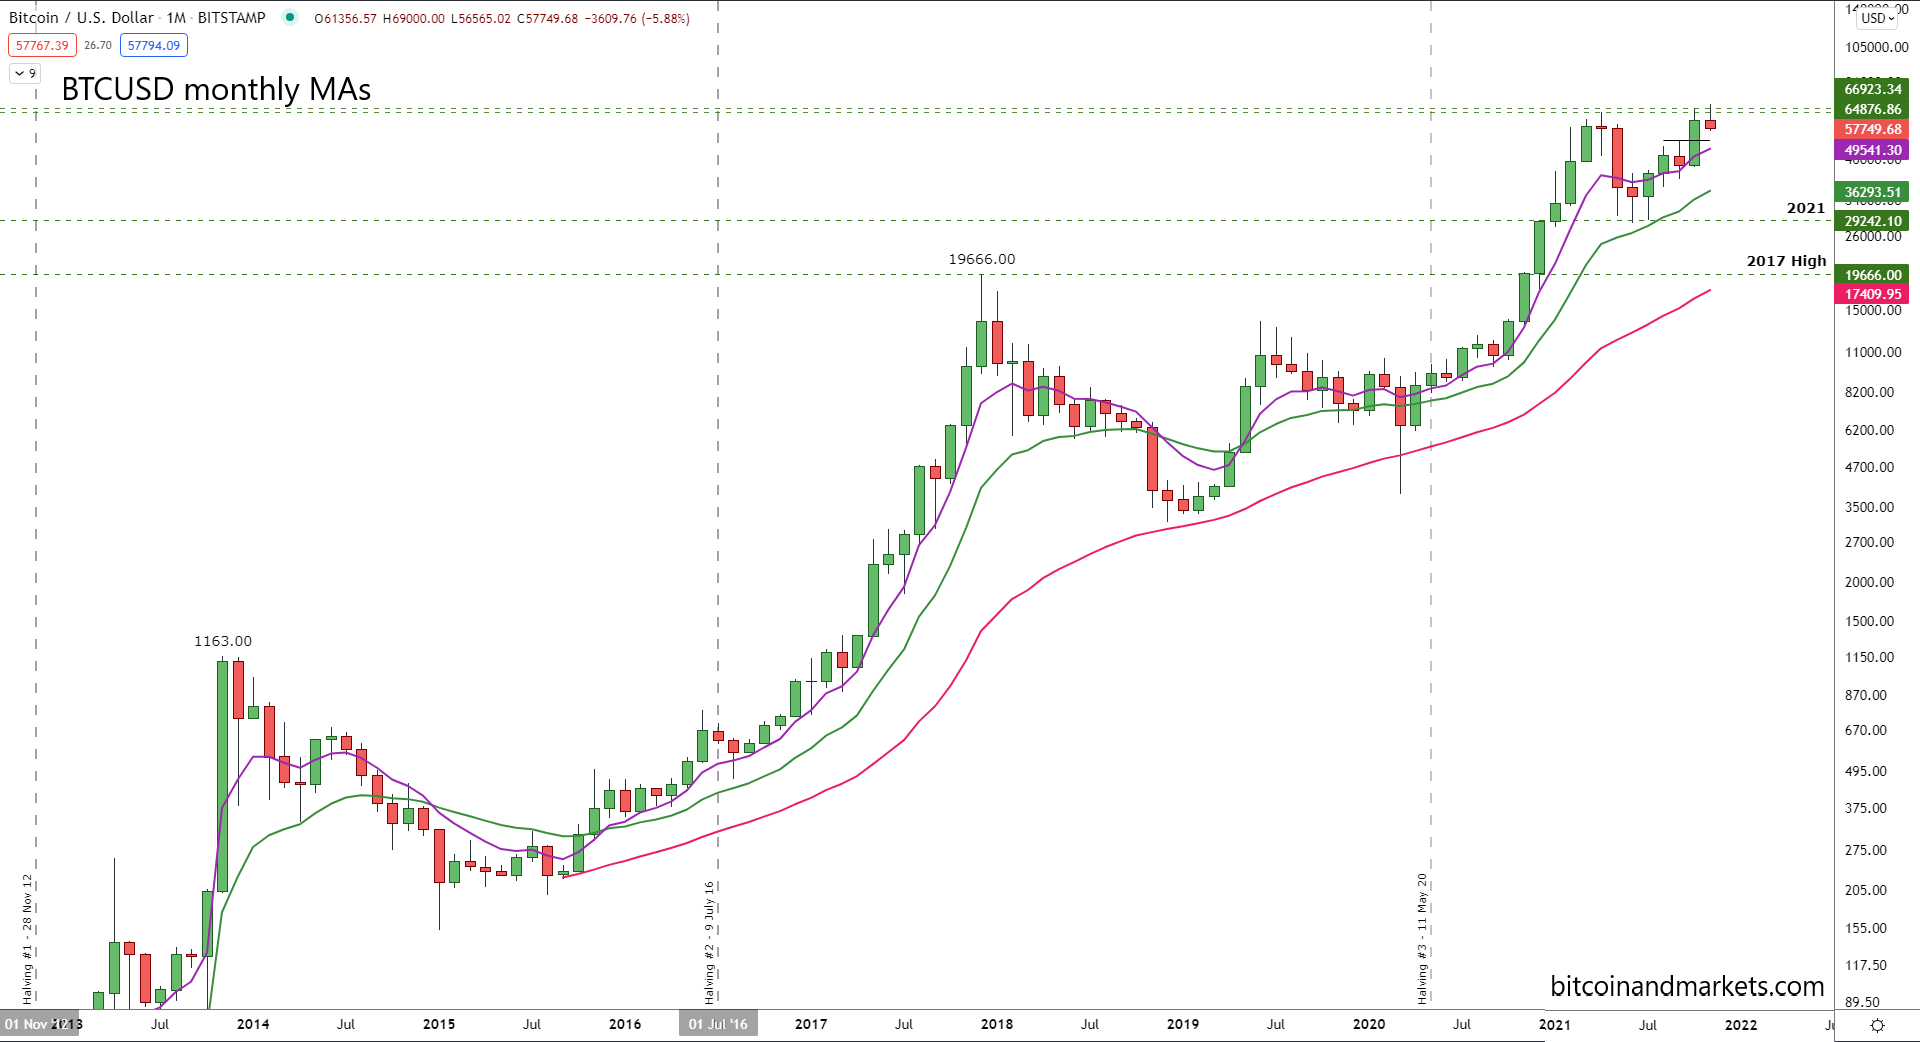
There is not much to see on the monthly. The 7 EMA is currently $49.5k, so if price does go sideways for another month that will give time for it to rise to the aforementioned $52.5k area. Here I switched to the 50 simple MA because it fit the data a bit better, but there's no major differences to be concerned about. The monthly is bullish, and has room to go sideways or even down to $50k before any damage would happen to this particular chart.
TD Sequential
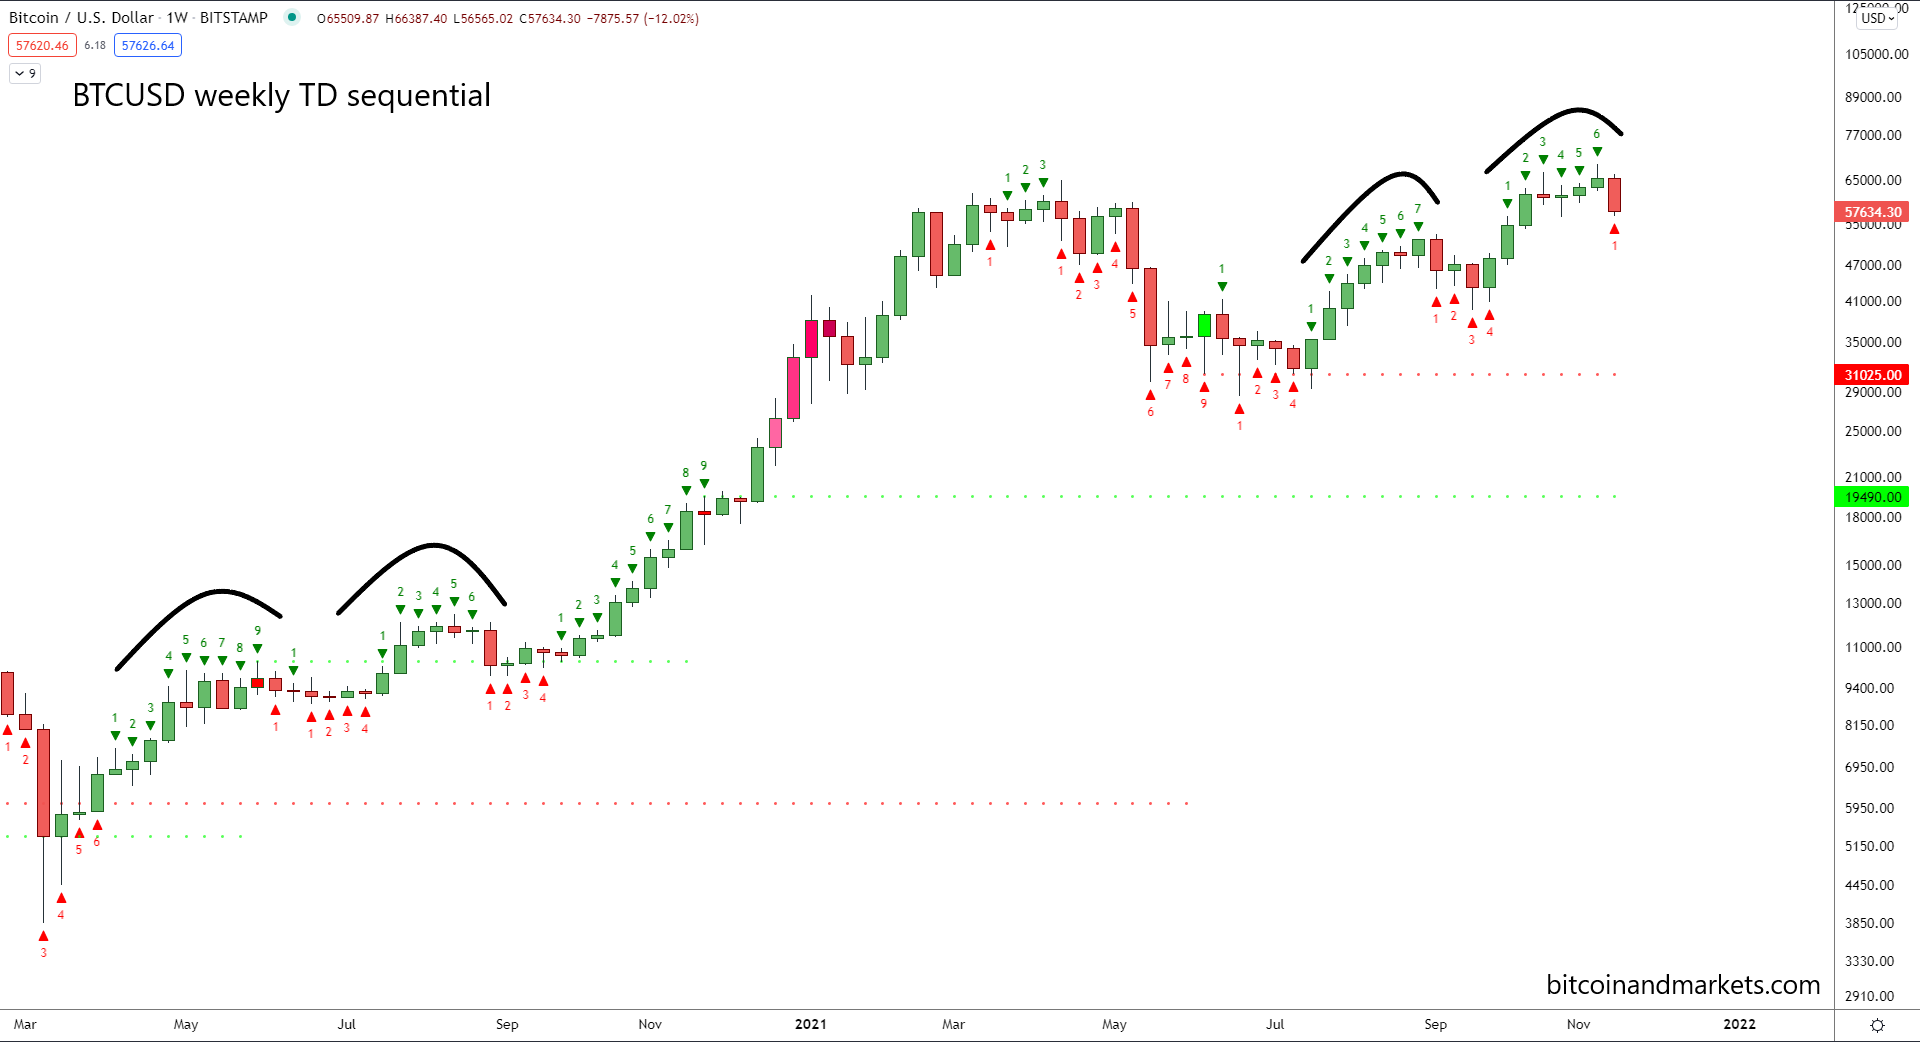
I mentioned Sept/Oct 2020 a couple times already, and on the weekly TD Sequential we see another similarity. The weekly count is 6, which is what we also saw during the consolidation last year, but I want to point out the general similarity in pattern here. The second wave was also the same number of green weeks, followed by a period of 4-6 weeks of sideways.
Oscillators
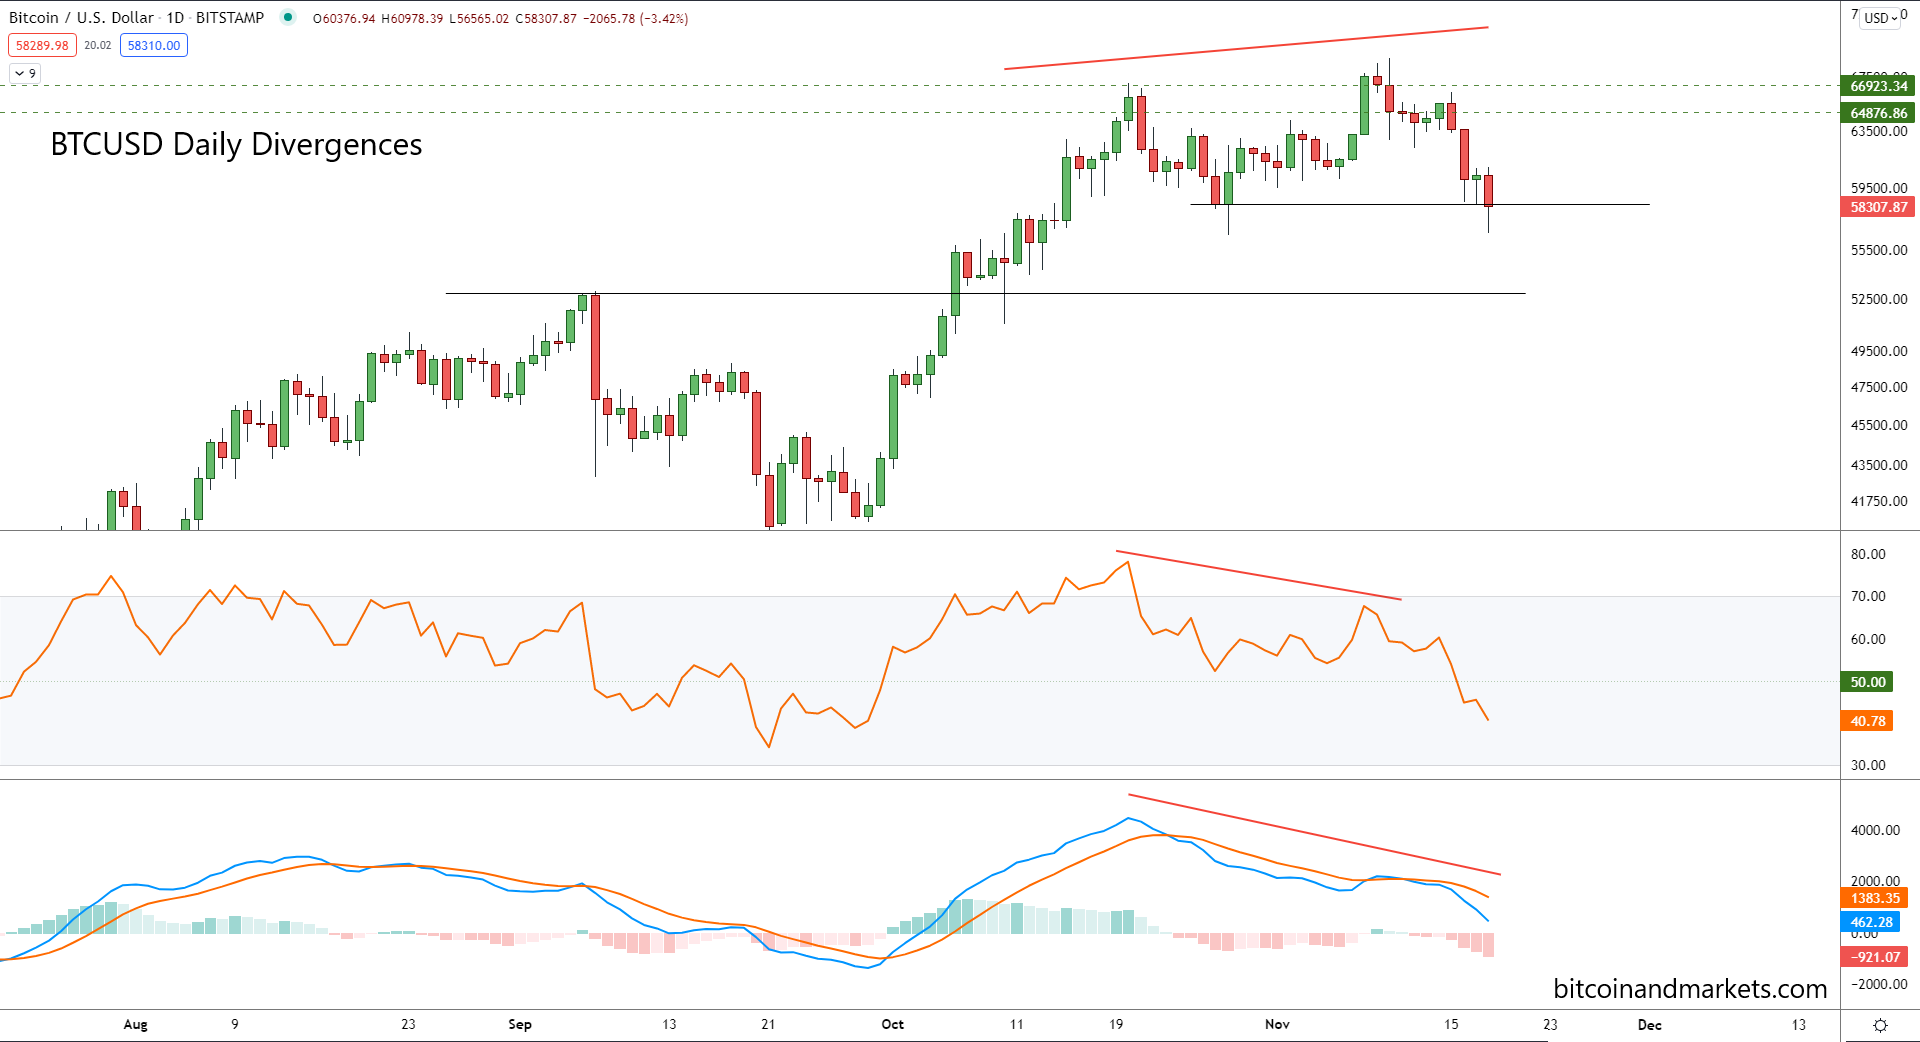
Looking to RSI and MACD we can see a very significant bearish divergence (higher high price, lower high on oscillators) which already played out. Price was just barely a higher high, but did say there for a full day. And responded by going down.
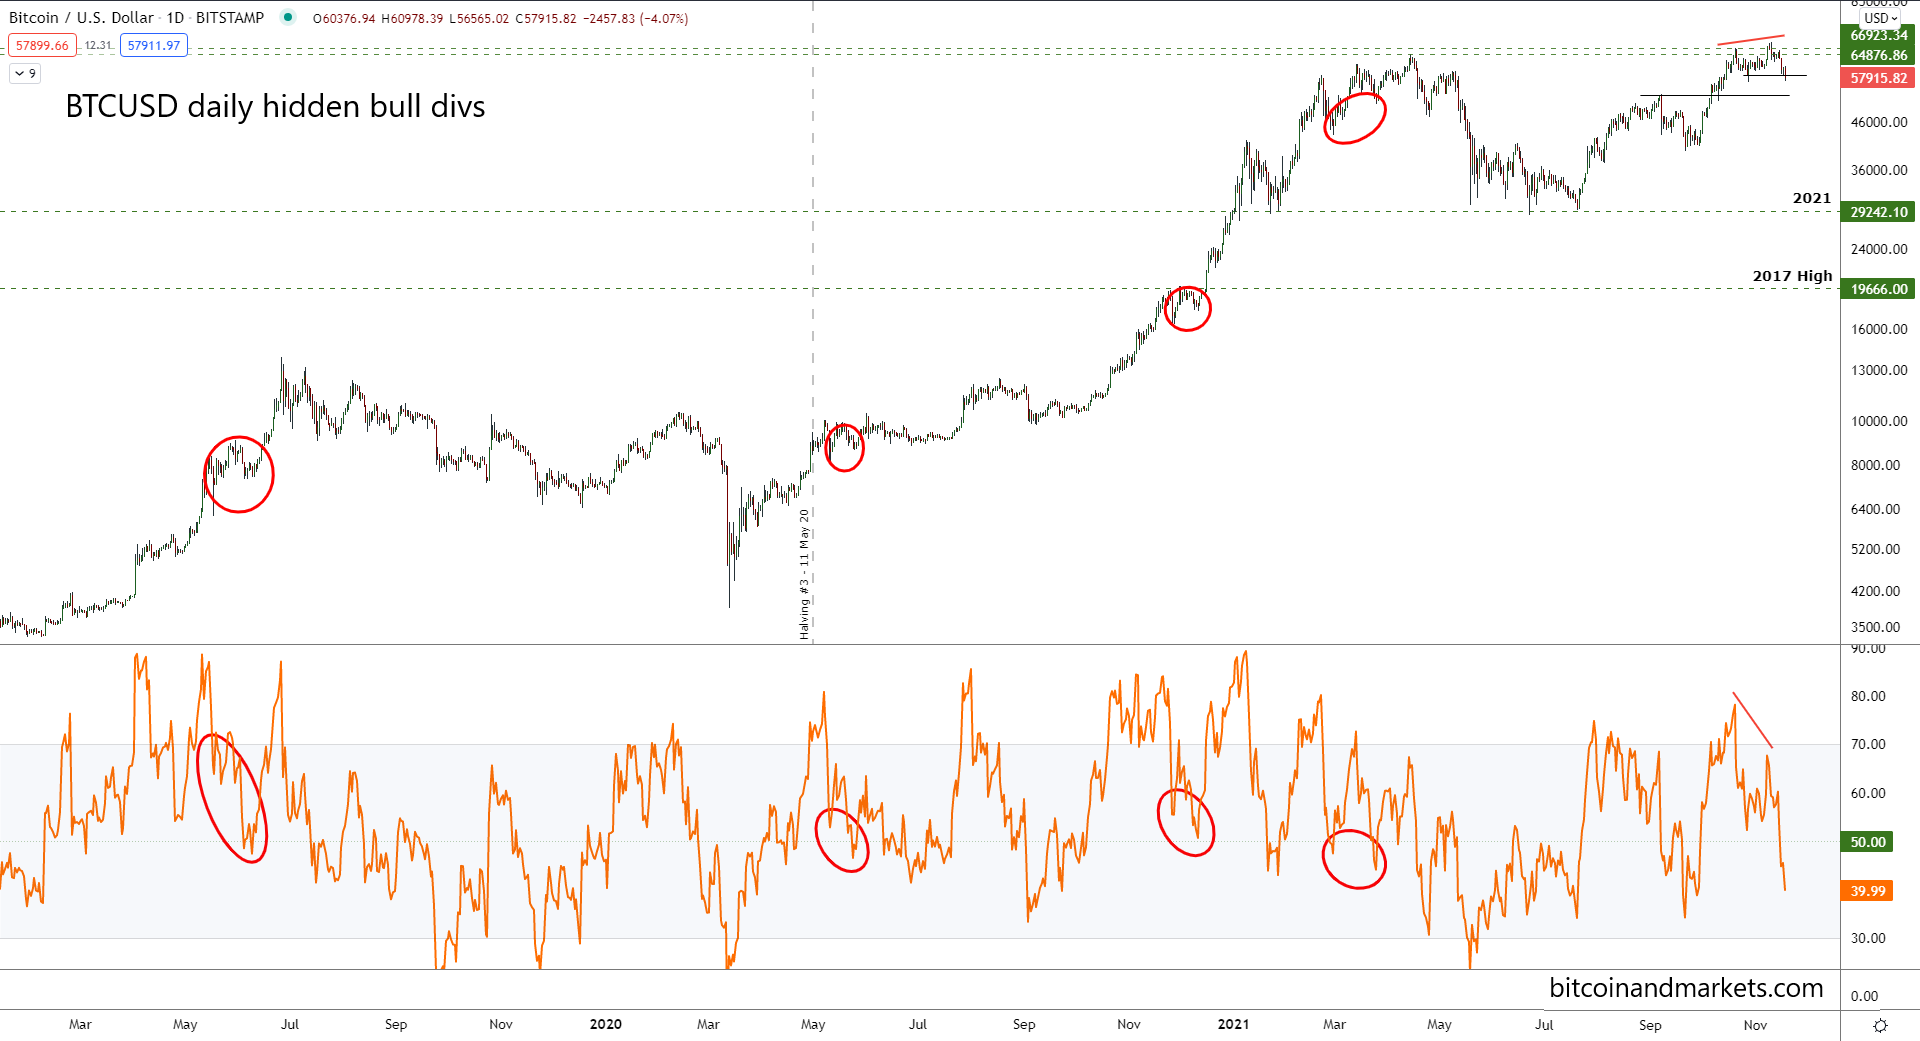
I added the block horizontal line right at the current price to demonstrate the possible zone for a hidden bullish divergence. If price can close and remain above $58,465 it will be a higher low on price and a lower low on the oscillators. I went back an looked for hidden bull divs on the daily and found several in the last couple of years.
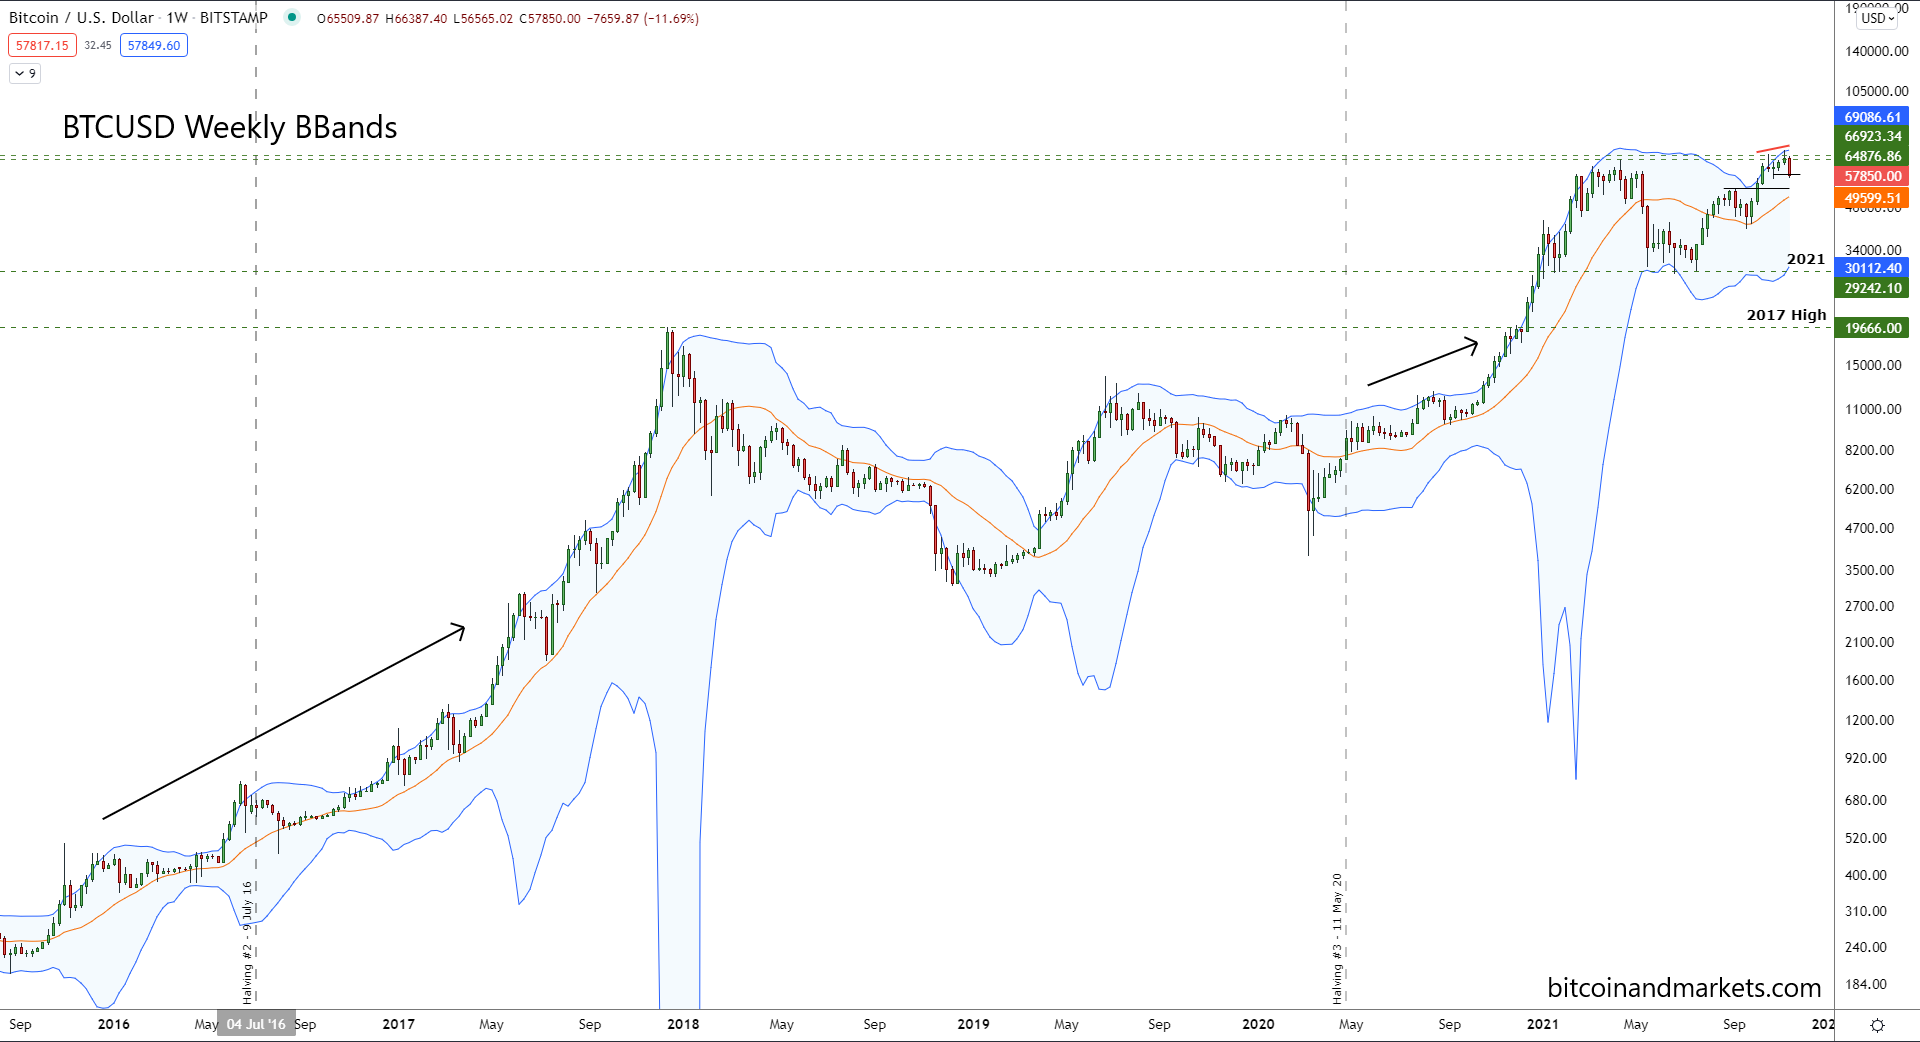
Bollinger Bands
I also wanted to take a look at the weekly Bollinger Bands for bitcoin. I included this a couple issues ago, as price was supported on the center line, and here's your update.
It might look a little messy, but I placed arrows at the other times I'm comparing to today. The 2017 rally bounced off the center line a couple of time (which is the 20-period simple moving average), and then again at the beginning of the 2020 rally can we see price bouncing off that center line.
Right now, the center line is $49.5k, but next week it will be, once again, up in the $52.5k range.
Conclusion
Starting from the long-term, I do not see anything to conclude the bull rally is over. Significant damage to the chart would have to be done, like falling below $50k with conviction and volume.
In the mid-term, that's anything between 1-6 weeks out, technicals are favoring further sideways in the area of $60k.
In the near-term, the next week, price is slightly bearish looking for support on $52.5k from multiple technical indicators.
Where else to find me : Fed Watch podcast | BTCM Research blog
The Bitcoin Dictionary is LIVE on Amazon!
* Price change since last issue
Thanks!
A