Bitcoin Fundamentals Report #216


Jump to: Market Roundup / Price analysis + Price Conclusion / Mining sector / Lightning Network
In Case You Missed It...
- (Article) Ghost money article I wrote for Bitcoin Magazine
- (Fed Watch) Jerome Powell Contradicts Fed's Own Statement, Chaos Ensues - FED 118
- (Fed Watch Clips) Full, Fed Watch only video this week
- (Podcast) Posting my daily live streams now. Check podcast feed and Rumble channel.
⬇️ Third hour of the below video ⬇️
Listen to podcast here
Market Roundup
| Weekly trend | Bullish |
| Media sentiment | Negative |
| Network traffic | Above average |
| Mining industry | Financial trouble |
| Market cycle timing | Turning corner bullish |
Bitcoin Headlines
Insolvency rumors flying again. Earlier this year, Luna and then Celsius imploded due to Ponzi finance. Now, FTX and its sister crypto fund Alameda, are apparently close to collapse. This would be a major developments because FTX and founder Sam Bankman-Fried were the main source of rescue funds for Luna and Celsius.

Liquidating our FTT is just post-exit risk management, learning from LUNA. We gave support before, but we won't pretend to make love after divorce. We are not against anyone. But we won't support people who lobby against other industry players behind their backs. Onwards.
— CZ 🔶 Binance (@cz_binance) November 6, 2022
The implication is Sam Bankman-Fried is working with some regulators directly against Binance interests.
This has led to a 47% reduction in FTX exchange's bitcoin balance so far!
The downhill effects are that some altcoins could get dumped by FTX to support their token's value.
Bitcoin Magazine did a great podcast episode about the upcoming software upgrade last month. Since then, the RBF debate has come up over and over again.
Here is a technical summary of the Replace-by-fee topic.
Replace-by-fee brings up the zero-conf debate. Is it safe to accept a recently sent transaction as confirmed, because it can take up to 10 mins for that transaction to get into a block? RBF by default will change the risk profile for point-of-sale retail outlets. It will also change the incentives around the Lightning Network, with marginal payment cases getting pushed to Layer 2.
At this point, it is not clear if it is good or bad.
This week, long time bitcoiner John Carvalho, painted RBF as an attack.
A subset of Core devs are currently trying to attack Bitcoin by forcing a pet agenda to make all transactions RBF by default.
— John Carvalho (@BitcoinErrorLog) November 3, 2022
This attack includes bitcoin-dev mailing list lies and lobbying, code changes in Core node, and bribery attempts to miners.
1/5
Macro headlines
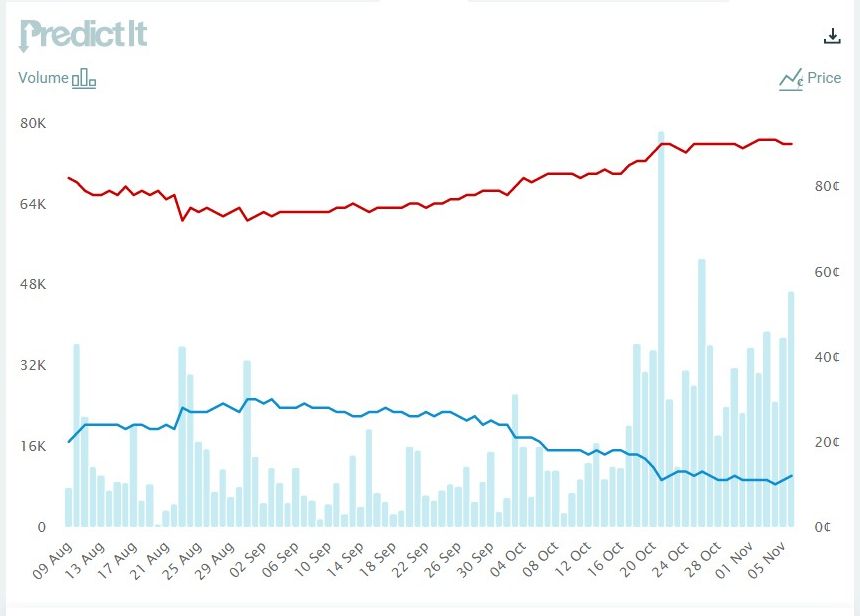
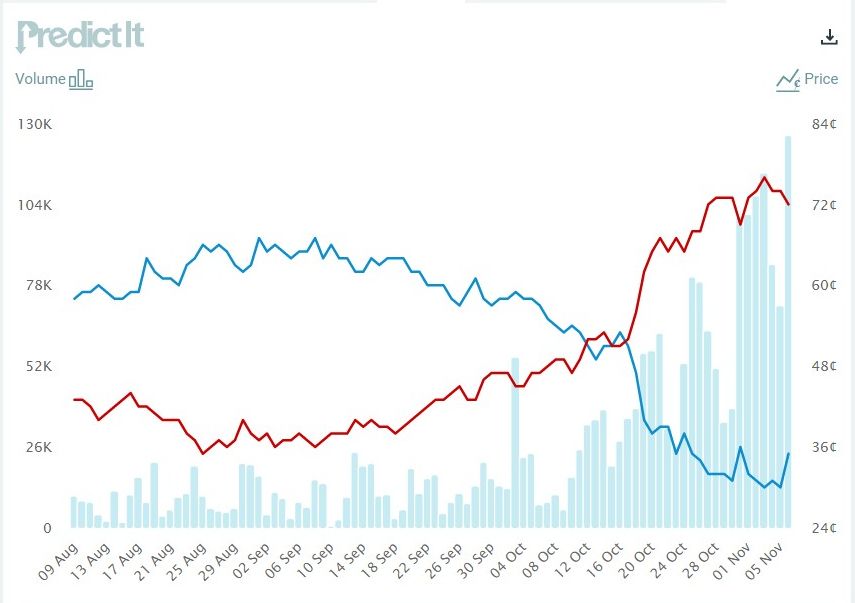
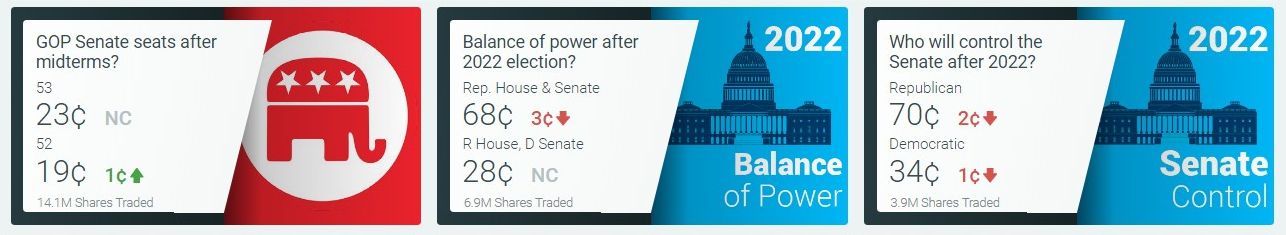
- US elections tomorrow!
As I called months or even years ago (the pendulum swings), the US midterm elections are looking like they will be a huge Red Wave this week.
Republicans, with a heavy dose of MAGA candidates, are likely to grab a massive majority in the House of Representatives and a commanding majority in the Senate. This will effectively put a kibosh on globalist spending, energy restrictions domestically, and brinksmanship with Russia.
Even if you take the woke social policies out of it, the globalists have absolutely zero positive economic policy. They are promising to destroy the economy. That's their plan to get elected, by promising higher prices and less economic activity. A Red Wave will be interpreted in a very bullish way. That is in the absence of more electioneering.
Price Analysis
| Weekly price* | $20,816 (+$432, 2.1%) |
| Market cap | $0.400 trillion |
| Satoshis/$1 USD | 4,802 |
| 1 finney (1/10,000 btc) | $2.08 |
Last week:
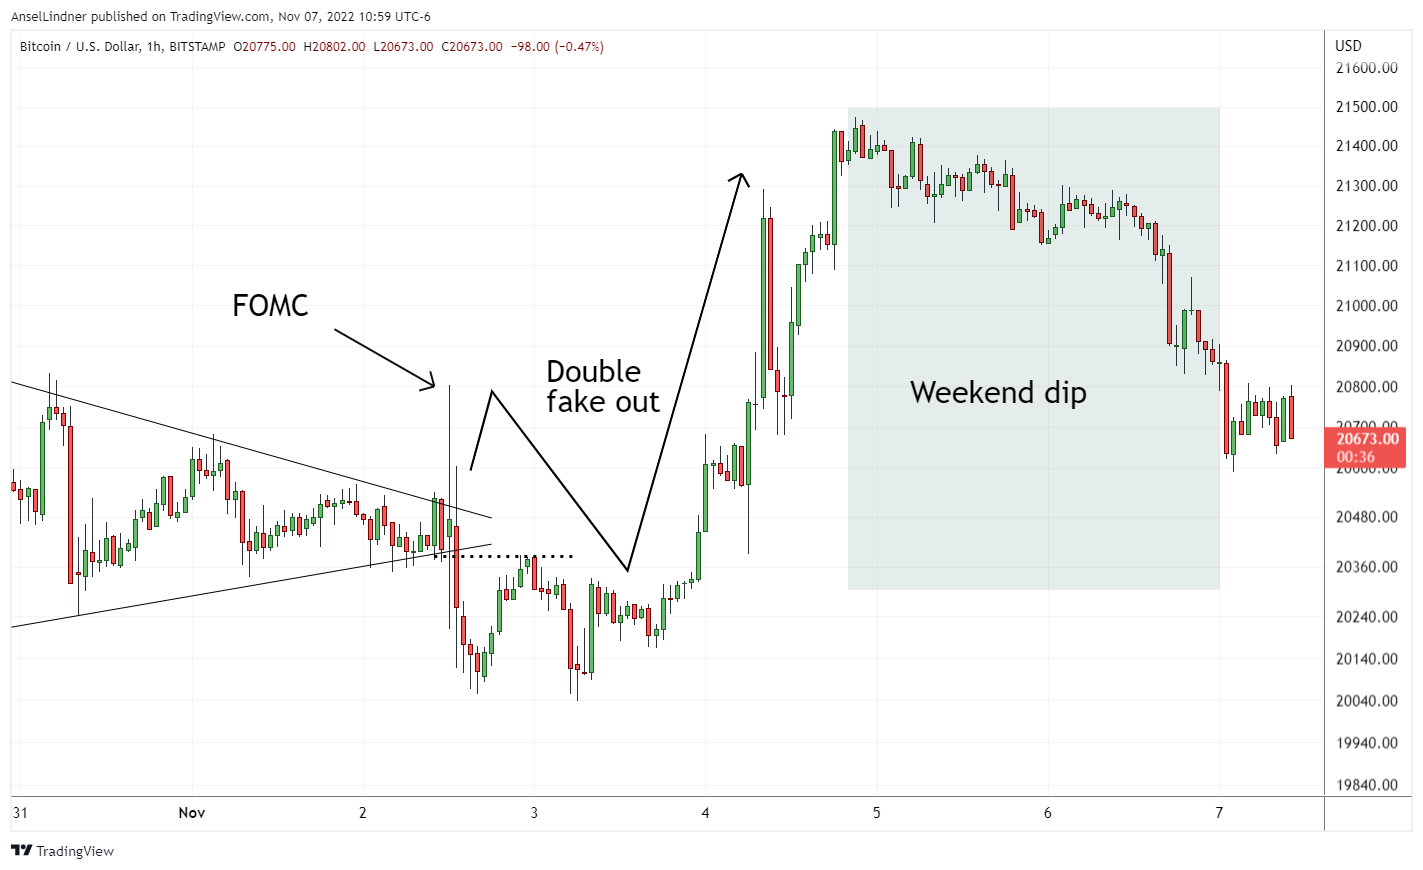
Be careful of a dip coinciding with the FOMC announcement Wednesday. The next few days could be a little slow for price leading to action later in the week.
It was a crazy week for the bitcoin price, including a double fake out. Last Wednesday, when the Federal Reserve dropped their written statement about their monetary policy decision, it was immediately interpreted dovish, and price popped at the end of the triangle flag pattern.
Just 30 mins later, when Chair Powell began taking questions, people interpreted his comments are bearish, and price reversed. That lasted a couple days, but then price began going back up again.
Hourly chart
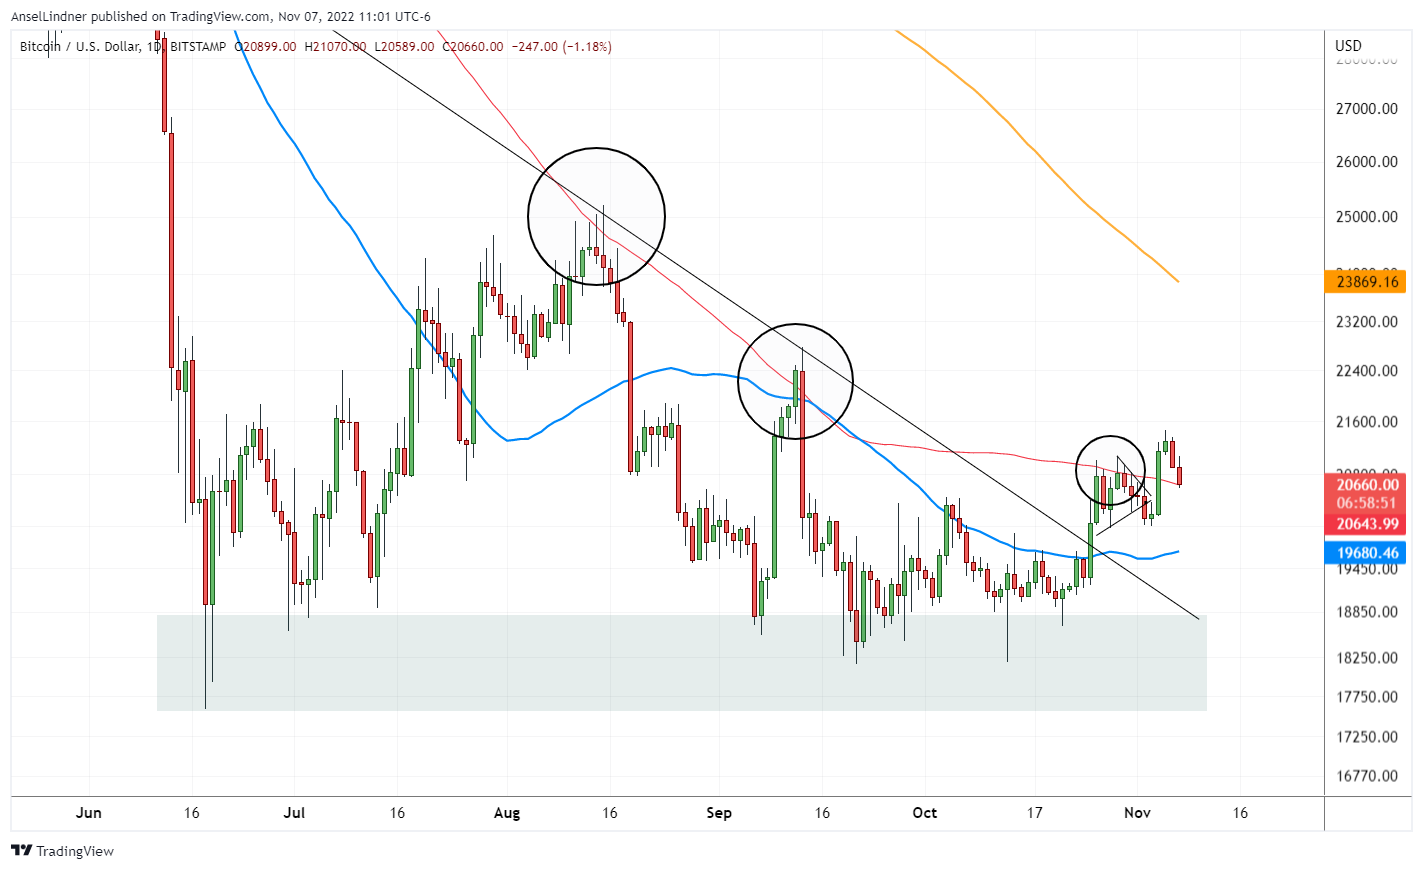
Daily chart
Bitcoin's bullish breakout has continued. Price has broken through the 50-day (blue) and 100-day (red) moving averages, the latter having rejected multiple prior attempts to break bullish. As it stands, the price is now checking support of that level.
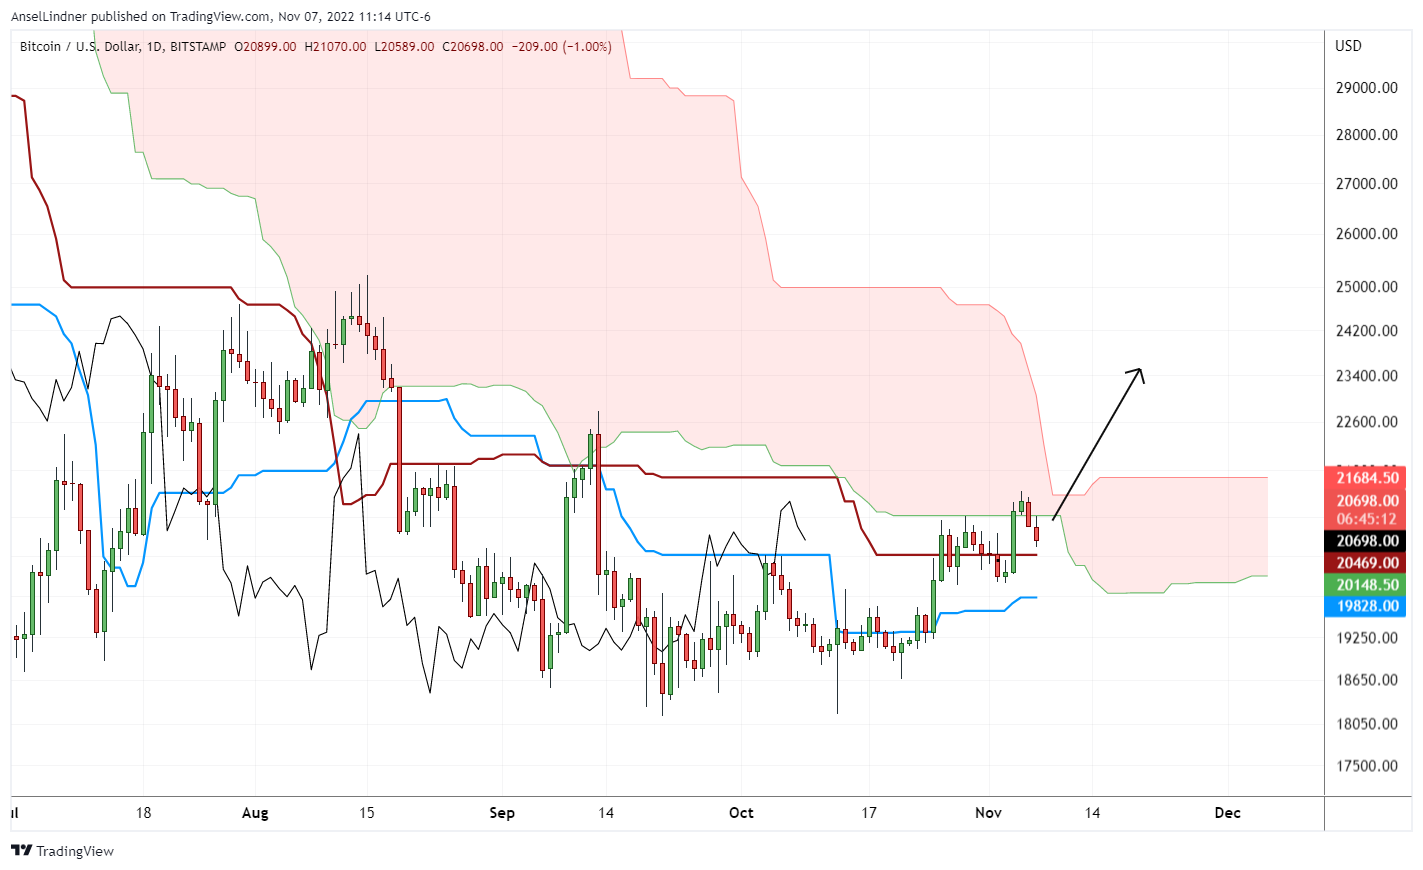
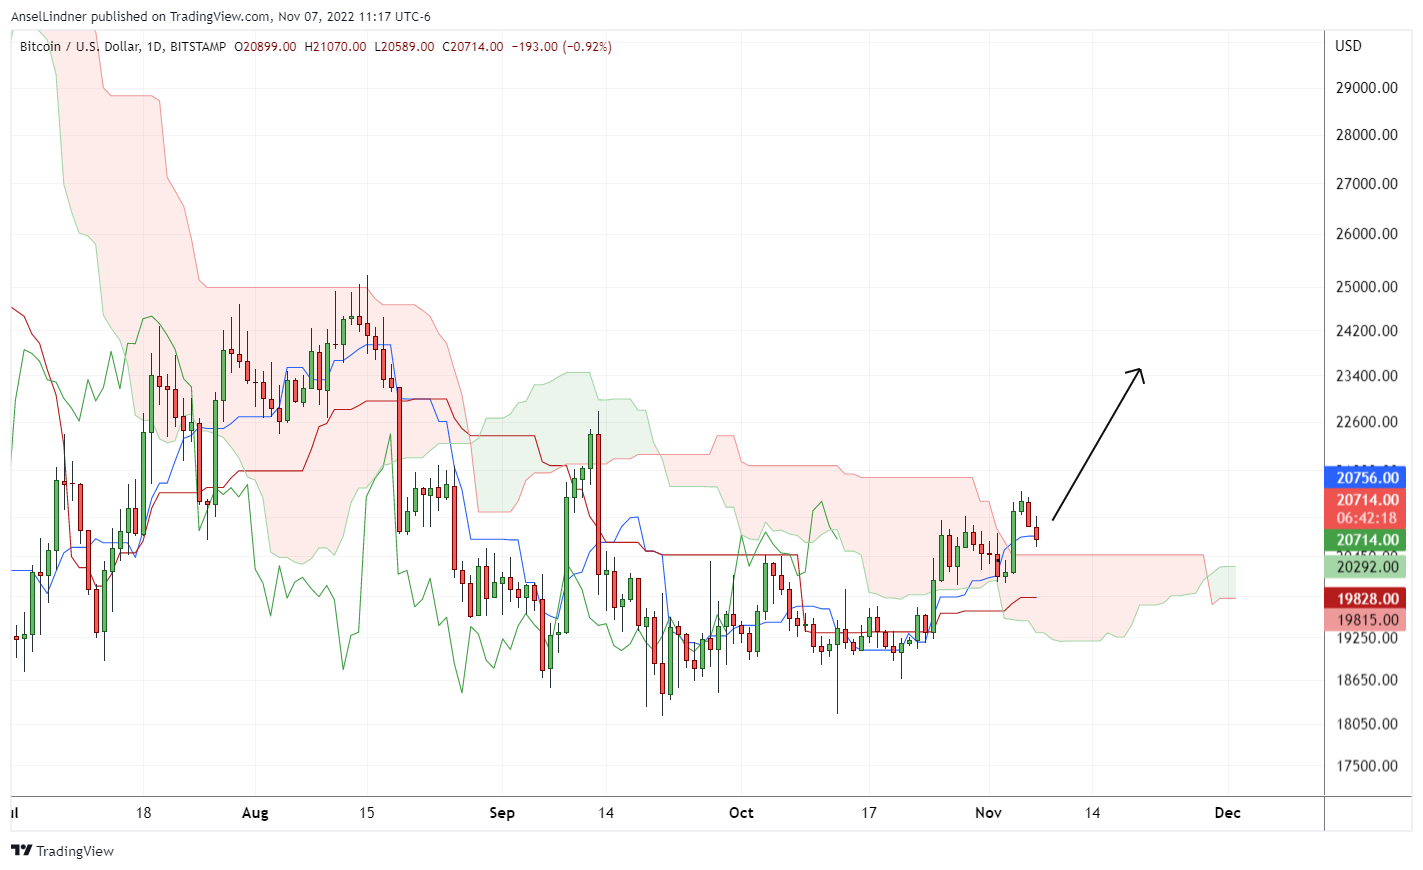
Ichimoku cloud
Revisiting the cloud again this week. First is the extended cloud (different setting due to 24/7/365 market) and a reminder from last week's report...
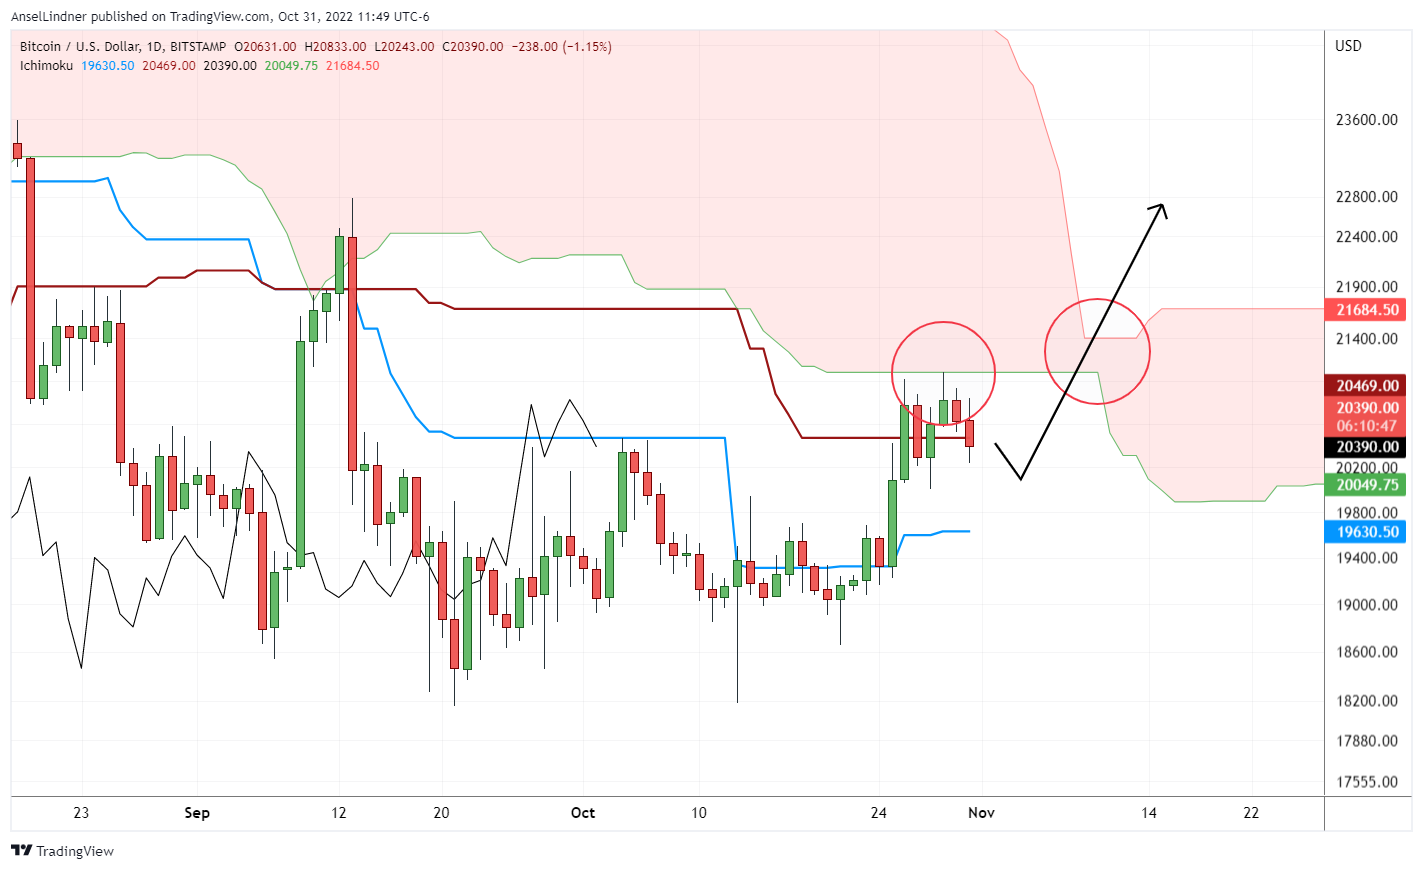
This week, we have come close to shooting this gap.
How about the standard Ichimoku cloud? Last week we were in the cloud.
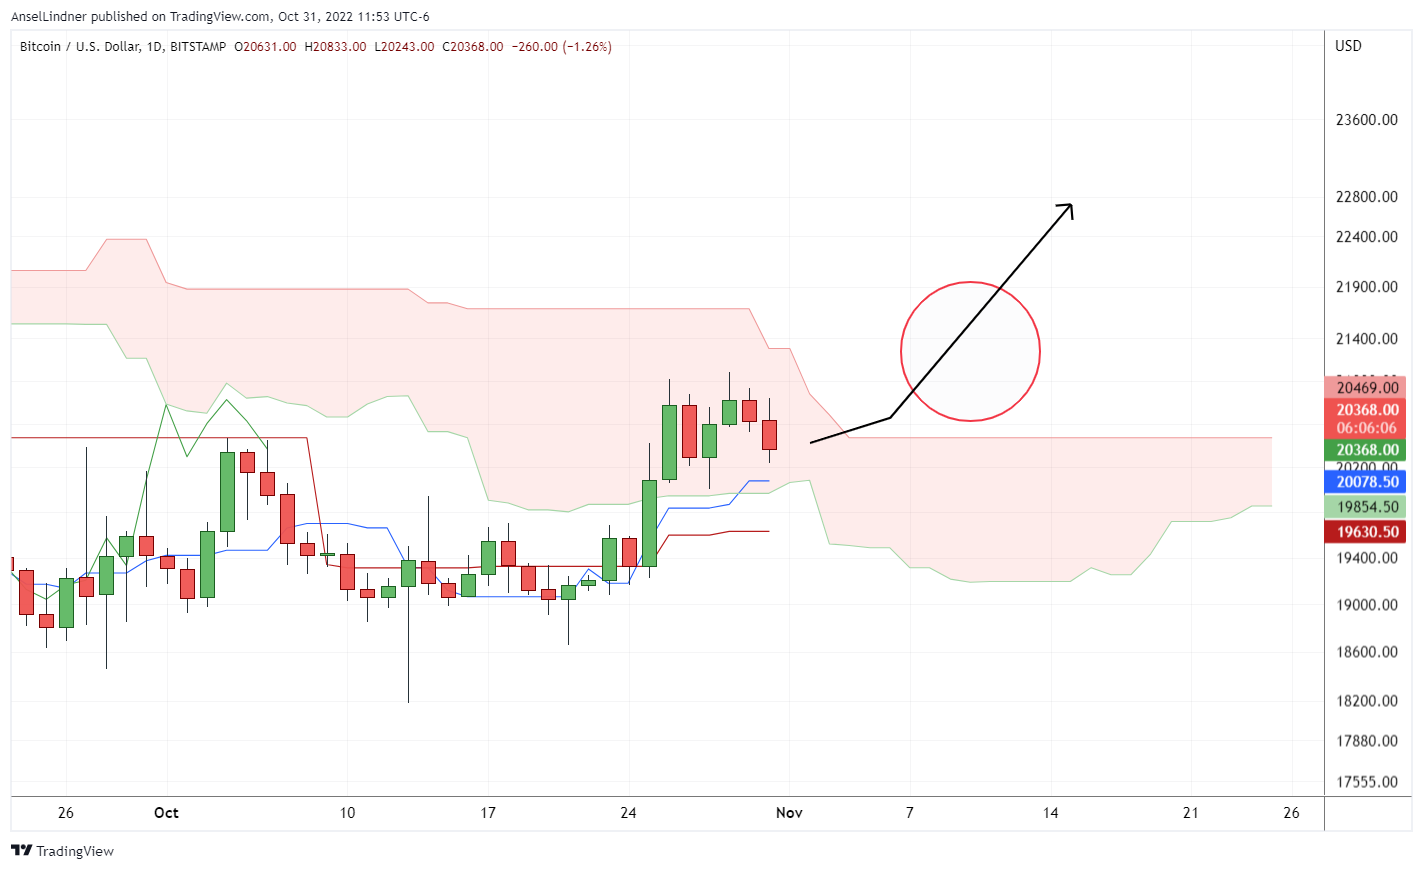
This week, the cloud on standard setting is very bullish. Price has broken out, as expected, above the cloud, which has twisted bullish (green twist on the right).
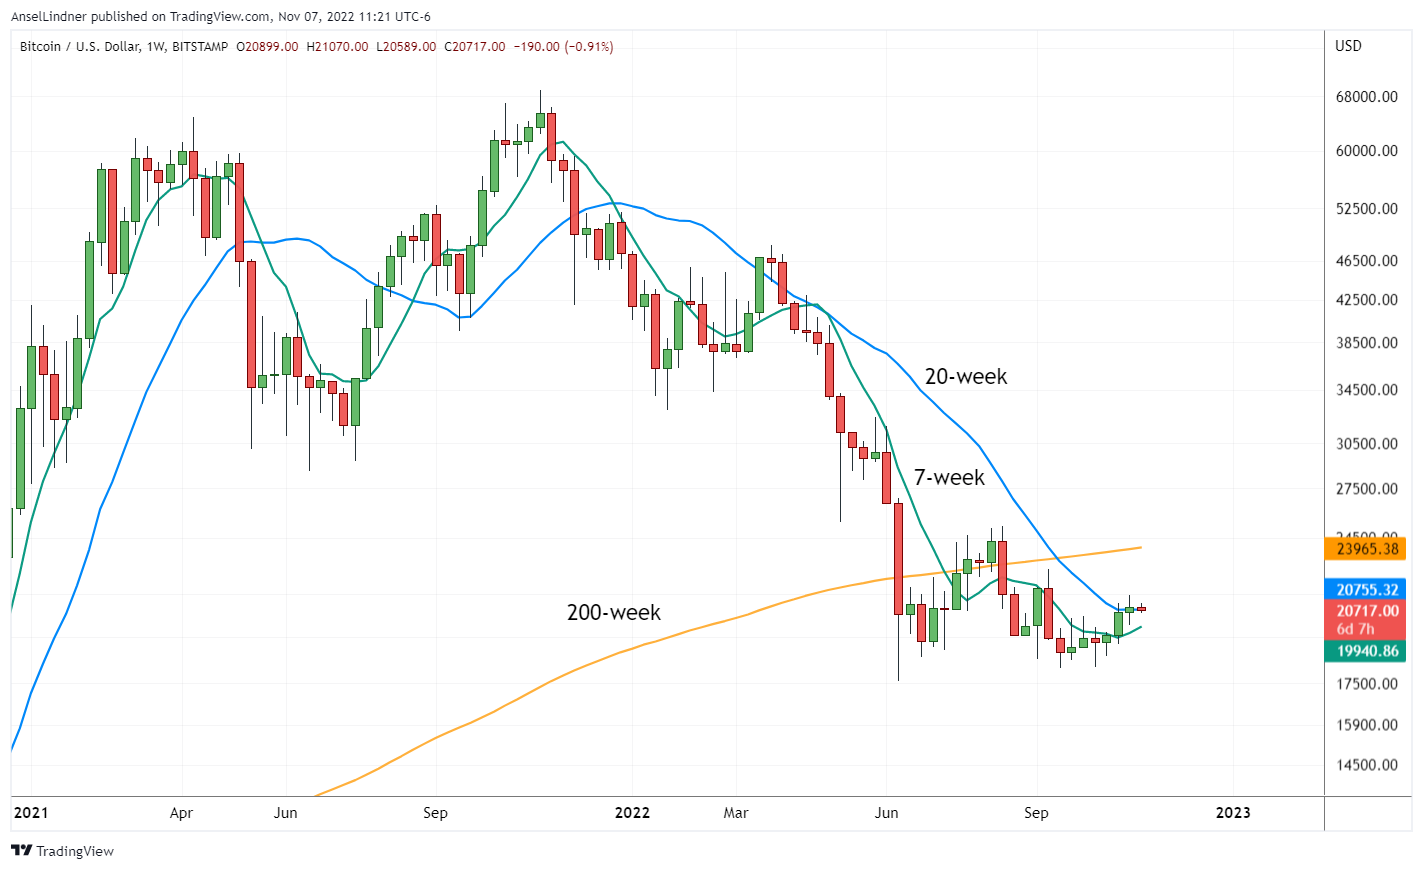
Weekly Charts
The weekly chart is screaming bullishness! Coming off the first-ever bullish divergence, the RSI is also coming out of being historically very oversold, and the MACD is turning upward in a very bullish posture.
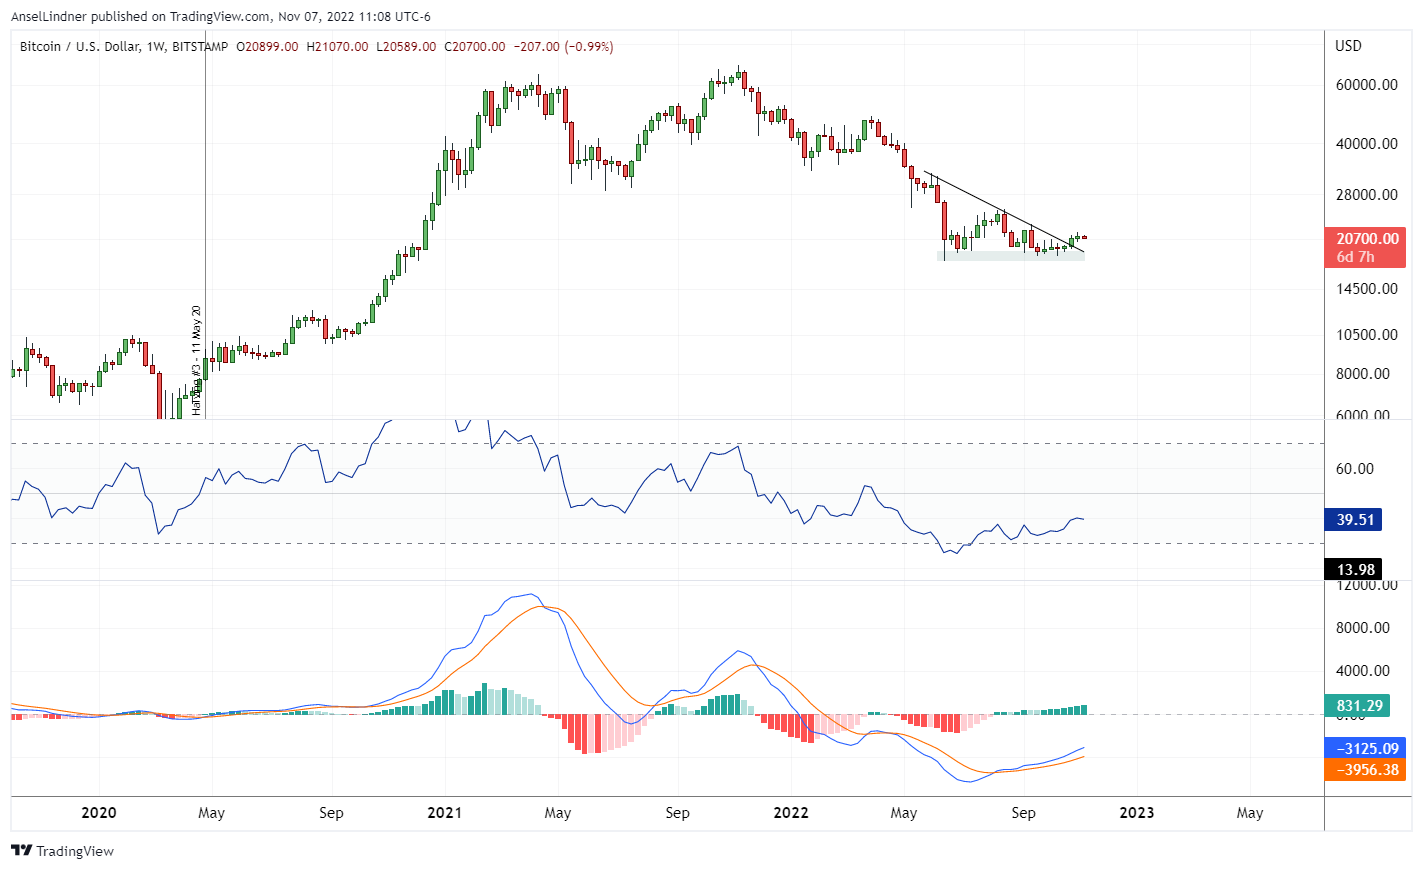
Price is toying with the weekly moving averages as well. The 7-week has been broken decisively, and the we are hanging onto the 20-week as we speak. The next big level is the 200-week moving average at about $24k.
Headwinds and Tailwinds
Dollar
Flash back to 2015 dollar action, and the move to the 1.618 Fib extension and new range.
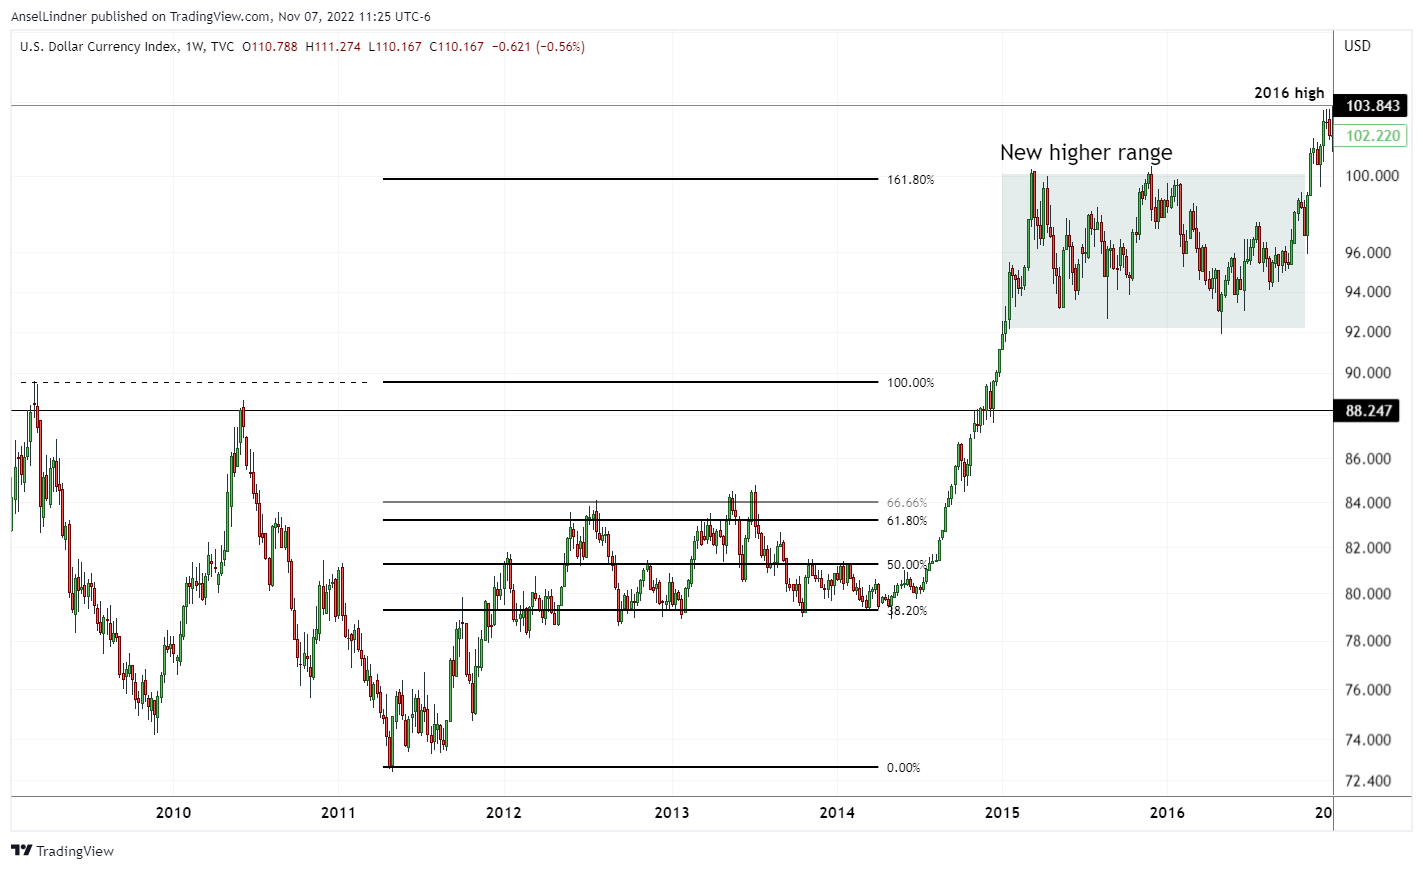
I expect the same fundamental reasons are behind this recent dollar surge, so we could expect the outcome to be similar. A dollar rally to a new higher range for a year or two. And that's exactly what we are starting to see, complete with the 1.618 Fib.
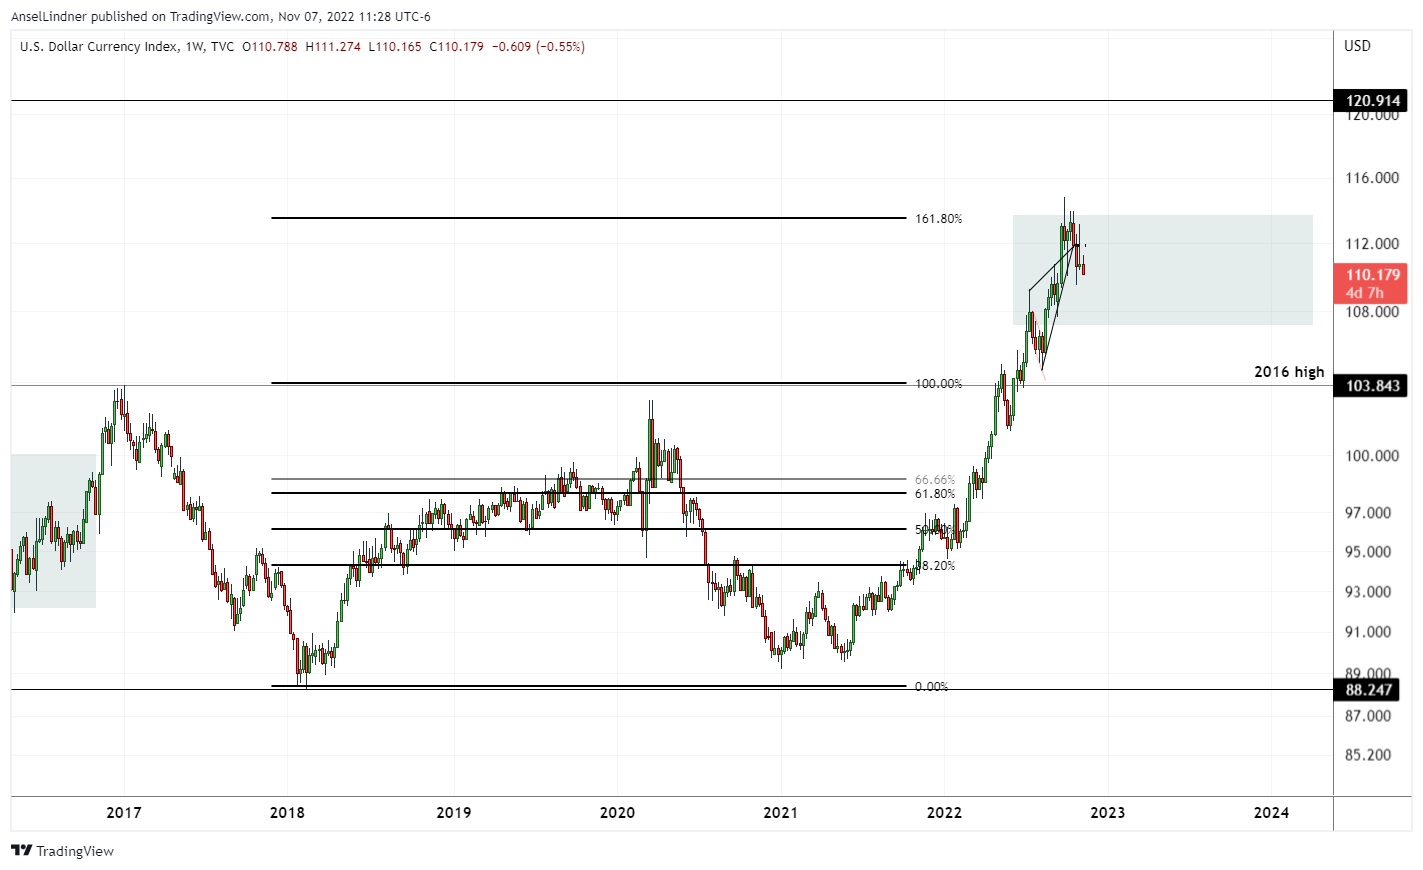
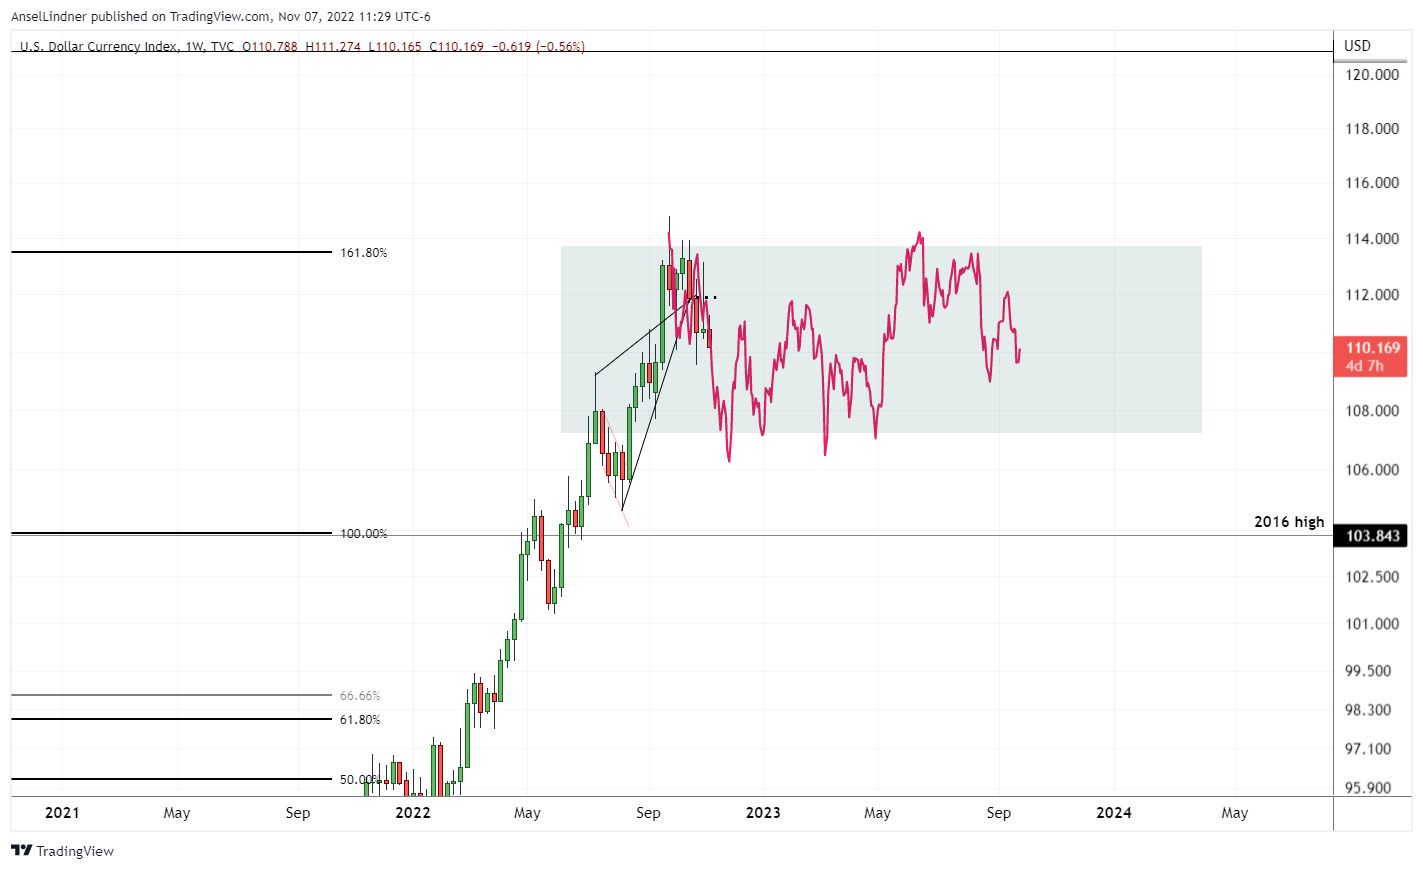
If I copy the pattern from the March 2015 top for one year, and put that starting at the current top, we get the following chart with my proposed new range. This means acute dollar stress will lessen from here on out, but economic damage from this rally will become more noticeable.
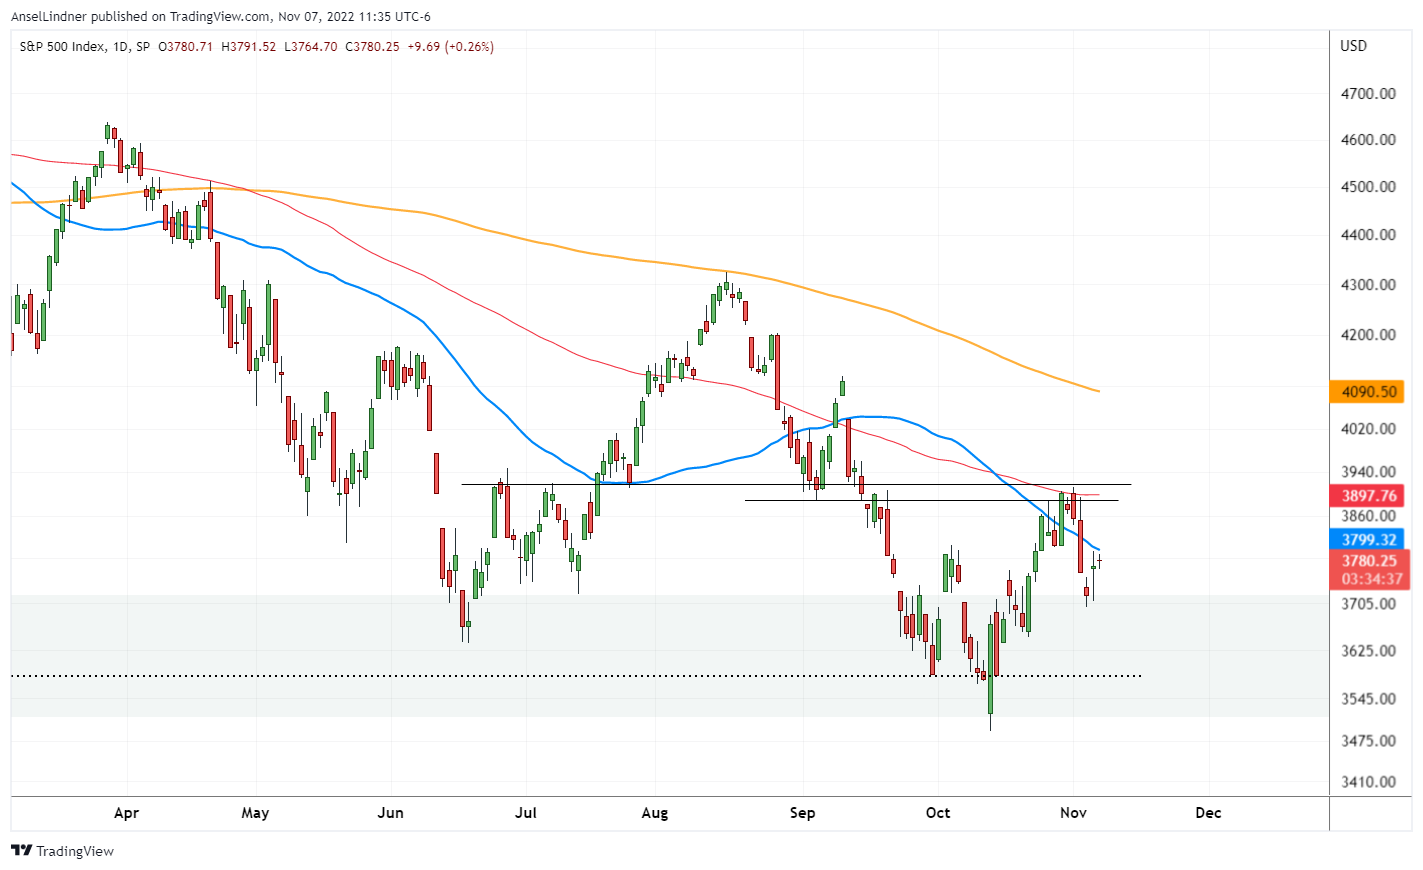
Stock Market
Stocks are trying to get their footing. I still lean bullish for both bitcoin and stocks, but stocks are giving a less clear signal than bitcoin at this time.
Specifically, the S&P 500 is below both the 50-day (red) and 100-day (blue) moving averages, where bitcoin is above both. A definite decoupling around important averages.
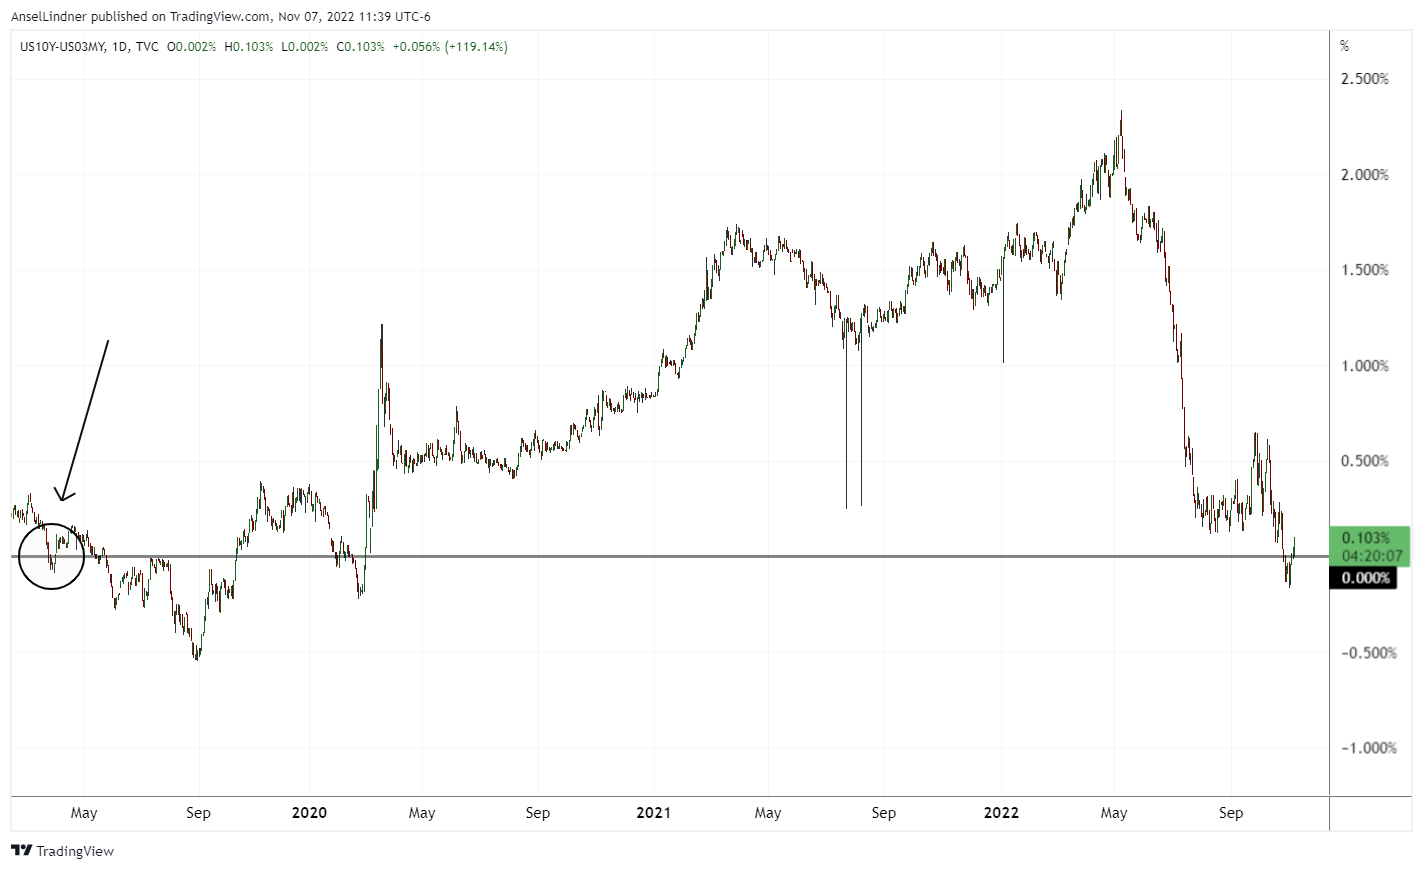
3-month to 10-year inversion
This important spread has un-inverted. On this long-term daily chart going back to 2019, you can see the extent of the inversion then was much deeper than today. Perhaps, there is a similarity to the initial small inversion around April 2019.
CPI
It is CPI week for the US. We expect a high M/M reading of somewhere close to 0.7%, due perhaps entirely to housing. The Cleveland Fed CPI nowcast is calling for 0.76% M/M.
Housing is a lagging indicator, with the effects of current conditions showing up in the data as late as 18 months to 2 years later. Housing is also a very important source of money printing. In our system, money printing does not come from the Fed or the Government but from banks making loans. Mortgages are a big part of that money printing. If many fewer mortgages are being taken out, that is a strong deflationary pressure.
Price Conclusion
Summarizing...
Bitcoin's short term charts show the FOMC double fake out. Daily charts show price in a bullish position above moving averages, and attempting to break out on the Ichimoku cloud.
Weekly charts are also in a bullish position. MACD is beginning to expand upward.
Global dollar stress seems to be weakening still. New acute stress may not appear until next year. This should be positive for stocks and bitcoin by easing liquidation pressure on risk assets which bitcoin is to a large part of the market.
CPI is expected to be much higher than the last 3 months. But all of the increase will be due to housing, which can be spun as not necessarily going to cause more rate hikes.
Overall, the risk of a volatile move lower in bitcoin is slightly higher than previous weeks, due to the FTX and Alameda fiasco. With global financial conditions slightly improving, and the Red wave election to Congress on Tuesday, we will likely see the markets react positively this week.
Without the risk of FTX collapsing, this would be a strong positive week for bitcoin, it is only the tail risk of that event that makes it hard to predict.
Mining
| Previous difficulty adjustment | -0.1995% |
| Next estimated adjustment | 2% in ~12 days |
| Mempool | 9 MB |
| Fees for next block (sats/byte) | $0.82 (28 s/vb) |
| Median fee (finneys) | $0.70 (0.337) |
Mining News
Rough times continue this week in the Bitcoin mining sector.

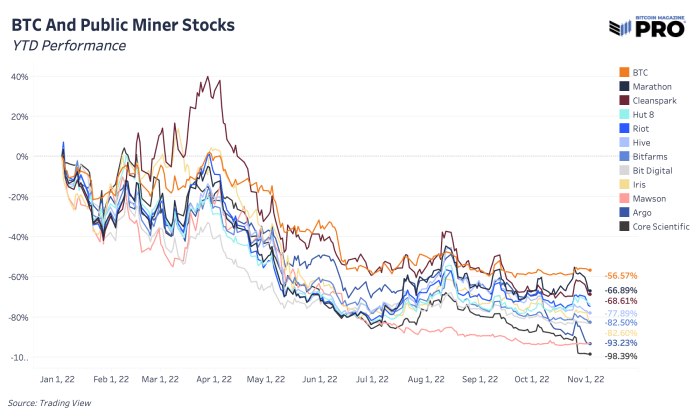
"One opinion from Marathon Digital Holdings CEO Fred Thiel, ballparks that 20 or so public miners could be at risk of going bankrupt in what he deems a perfect storm for the industry. There’s no doubt that larger, better positioned miners are looking for potential, favorable acquisition deals to arise fairly soon. Like every other industry before it, major industry consolidation is inevitable and public bitcoin mining looks primed to go through that next phase of its lifecycle. It’s likely we move to a world where there are only a few major bitcoin miner giants with a handful of much smaller miners behind them."
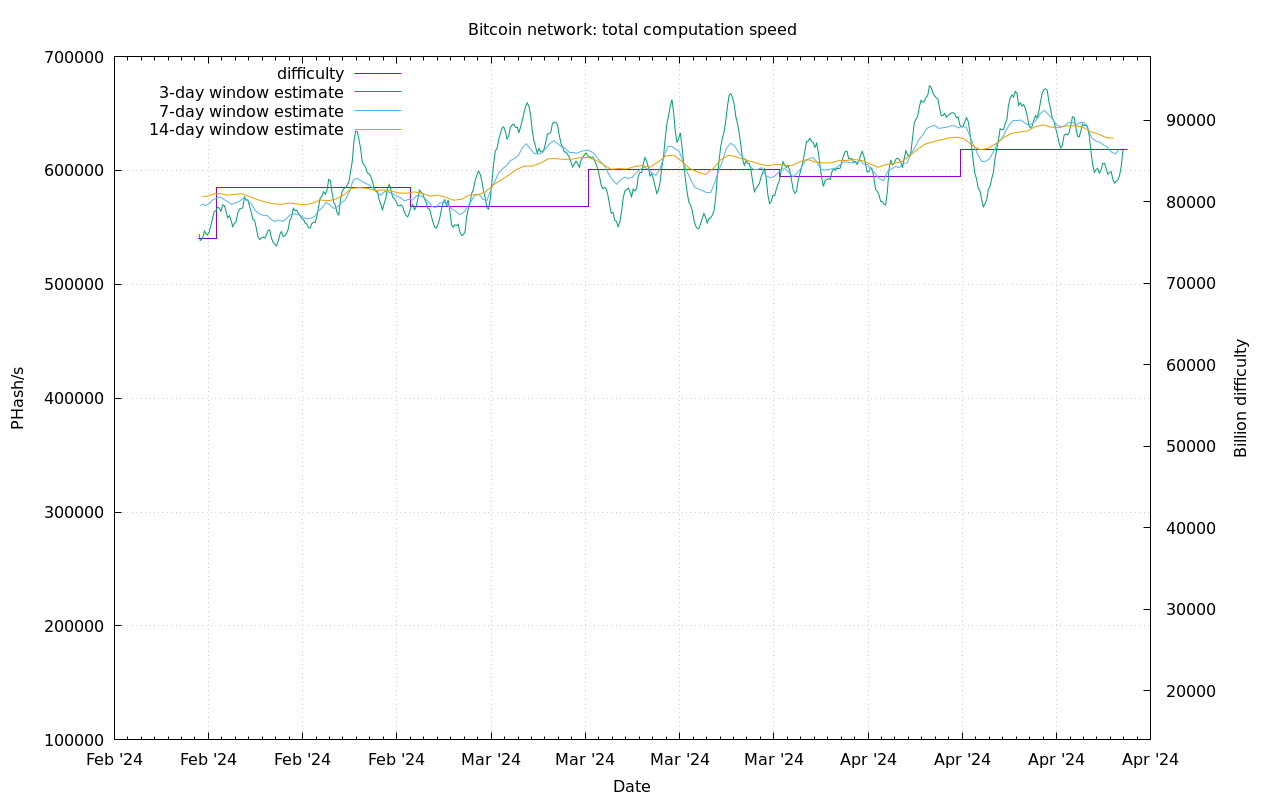
Difficulty and Hash Rate
Difficulty adjusted lower by a tiny 0.1995% yesterday. Based on early blocks in the next difficulty epoch, it is estimated to rise 2% in 12 days.

Lightning Network
Another Lightning Bug was discovered this week, by the same developer at the center of the incident from two weeks ago.
Burak was back again to disrupt btcd and LND with the type of transaction you see above: a P2TR (pay-to-taproot) spend containing N OP_SUCCESSx with 500,001 pushes, which exceeds the limit hardcoded into btcd. While the 998-of-999 tapscript multisig transaction seemed to be an honest mistake, yesterday’s transaction was an overt exploit in the wild by Burak.
It is good that someone is attacking the LN like this at a time when it isn't big enough to cause too many problems. It is not the greatest thing to have these bugs, but it is better to catch them now, than years down the road when a much large economy on top of Lightning would be affected.
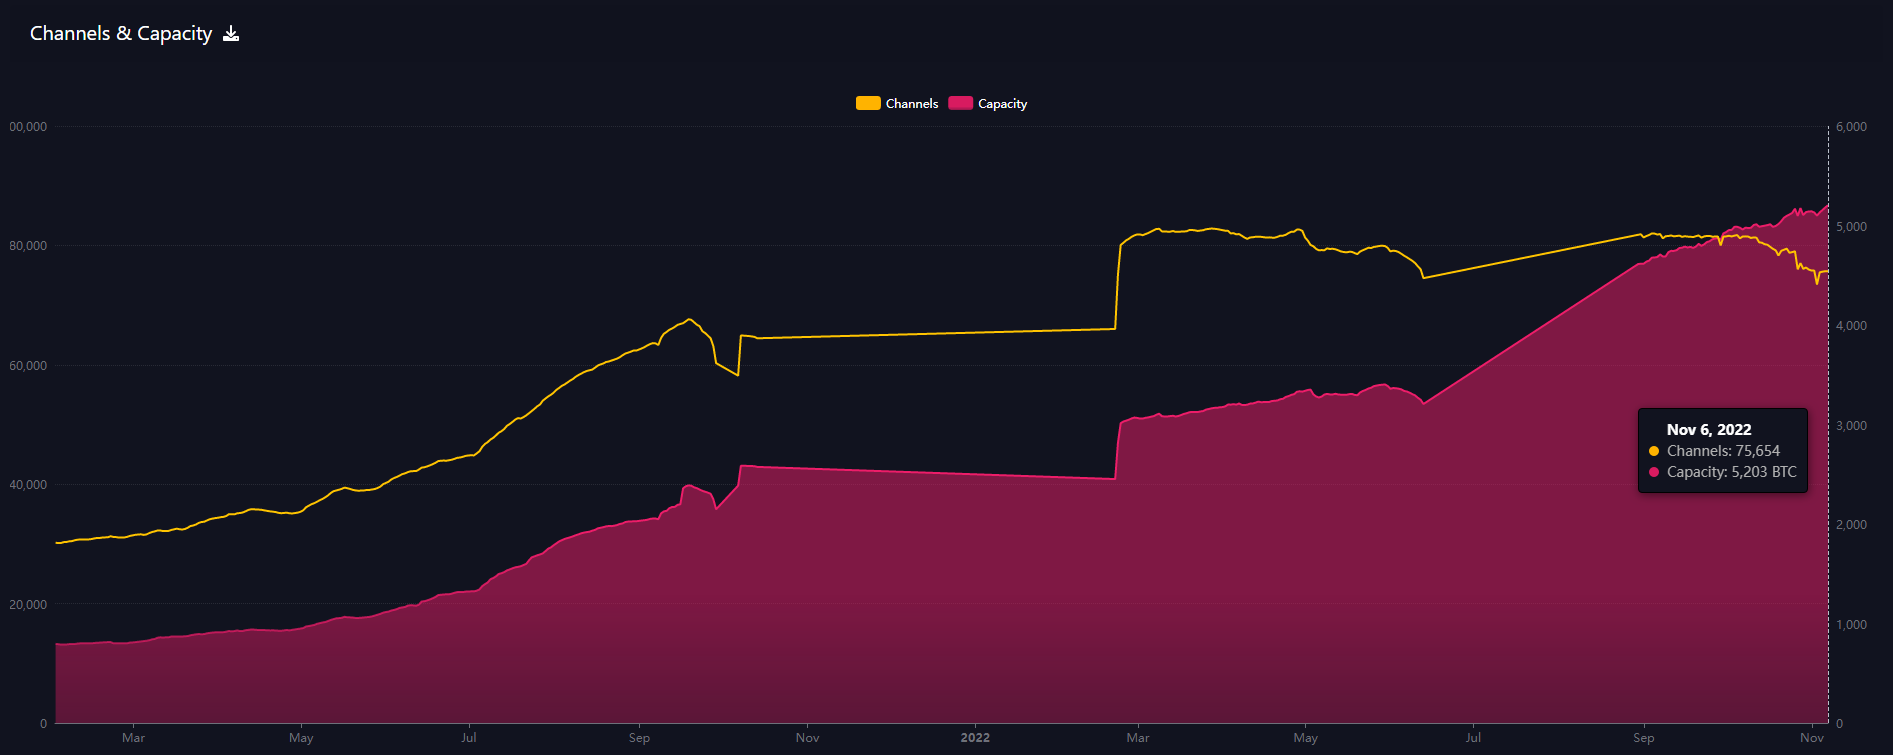
Capacity
Despite the recent bugs, lightning capacity continues to grow. Now surpassing 5,200 btc!
That's it for this week. See you again next Monday!!!
A
- Were you forwarded this newsletter? You can subscribe here.
- Podcast links and socials on our Info Page.
- If you liked this newsletter please SHARE with others who might like it!

November 7, 2022 | Issue #216 | Block 762,166 | Disclaimer
* Price change since last week's report