Macro Update - 30 June 2022
We find ourselves at the end of Q2 and about to "officially" enter a recession. They are a little late to the party...
How fast is the inflation scare and taper talk going to turn back into recession and even more QE? Pretty quick.
— Ansel Lindner (@AnselLindner) July 20, 2021
Maybe a little early on that one, but technically, the recession started only 6 months after that tweet in January.
In March, I was saying we were already in recession, long before official GDP numbers came out for Q1. Q1 has been revised several times, the most recent is now a -1.6% annualized decline.
We are possibly in a recession already. What does the #Fed do? https://t.co/JsXU5JF2fz
— Ansel Lindner (@AnselLindner) March 3, 2022
Bretton Woods 3 died quickly as expected. I haven't heard anything about it or Zoltan Poznar for a couple months. Global recession is here.
All the talk about Bretton Woods 3 doesn't seem to be pricing in political revolution and war.
— Ansel Lindner (@AnselLindner) April 2, 2022
Global recession, regional food and energy shortages, and political instability will increase faster than BW3 plans.
The below tweet probably needs some more context...
Picture the Fed last summer, they expected recession within 6-12 months (recovery was transitory), yet you were doing QE with rates at 0-0.25%, and CPI climbing through 5%.
— Ansel Lindner (@AnselLindner) June 13, 2022
What would you expect them to do? https://t.co/xB4Q0EwbFh
The Fed is a follower who does not physically control anything. All their power comes from Fed mythology and influencing the market through rhetoric. Last summer, Powell saw the recession coming (like I did), and knew this recession would kill price increases (CPI). Recessions crush demand faster than supply.
Powell wanted to be able to pivot back to easing to influence the market to a soft landing. But he couldn't do that if their Fed Funds rate was at zero and they were already doing QE. So, he set out on a path of aggressive rate hikes, to get ready for this moment where he could pivot.
Today, we get this tweet from the Atlanta Fed. -1% for Q2. That's an official recession folks.
On June 30, the #GDPNow model nowcast of real GDP growth in Q22022 is -1.0%. https://t.co/T7FoDdgYos #ATLFedResearch
— Atlanta Fed (@AtlantaFed) June 30, 2022
Download our EconomyNow app or go to our website for the latest GDPNow nowcast. https://t.co/NOSwMl7Jms pic.twitter.com/t87bBJGRsv
The best chart to explain everything
I have a whole bunch of charts I want to put in this post, but don't want it to get too long. I'll start with the chart I think is very instructional about where we are and puts this market in context, cotton.
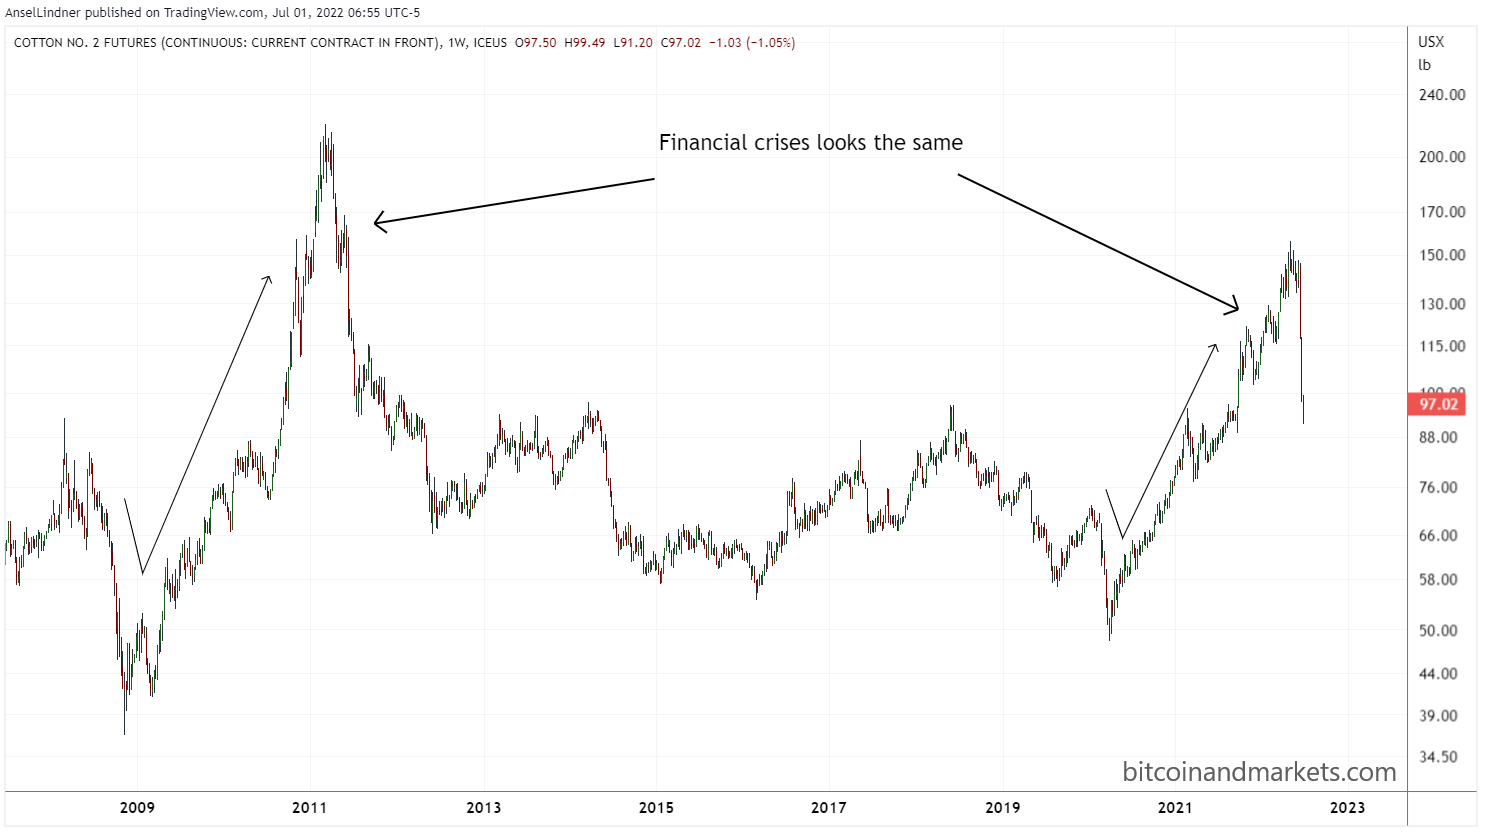
The recent crash in cotton should signal to people that the "inflationary" pulse is over, things are returning to normal. The price action over the last couple of years is very similar to during and after the Great Financial Crisis; a big dip at first, followed by a crazy rally and sharp sell off.
This chart is a perfect example of my macro outlook. I think what we've experienced is an economic shock, but fundamentally nothing has changed. We will return to "post-GFC normal".
Also, and very important here, is cotton prices did not reach the heights seen in the GFC. How is that possible if we have so much inflation?? It's not (remember, QE and government borrowing is not money printing). It's a pattern we see repeated time and time again in commodity charts.
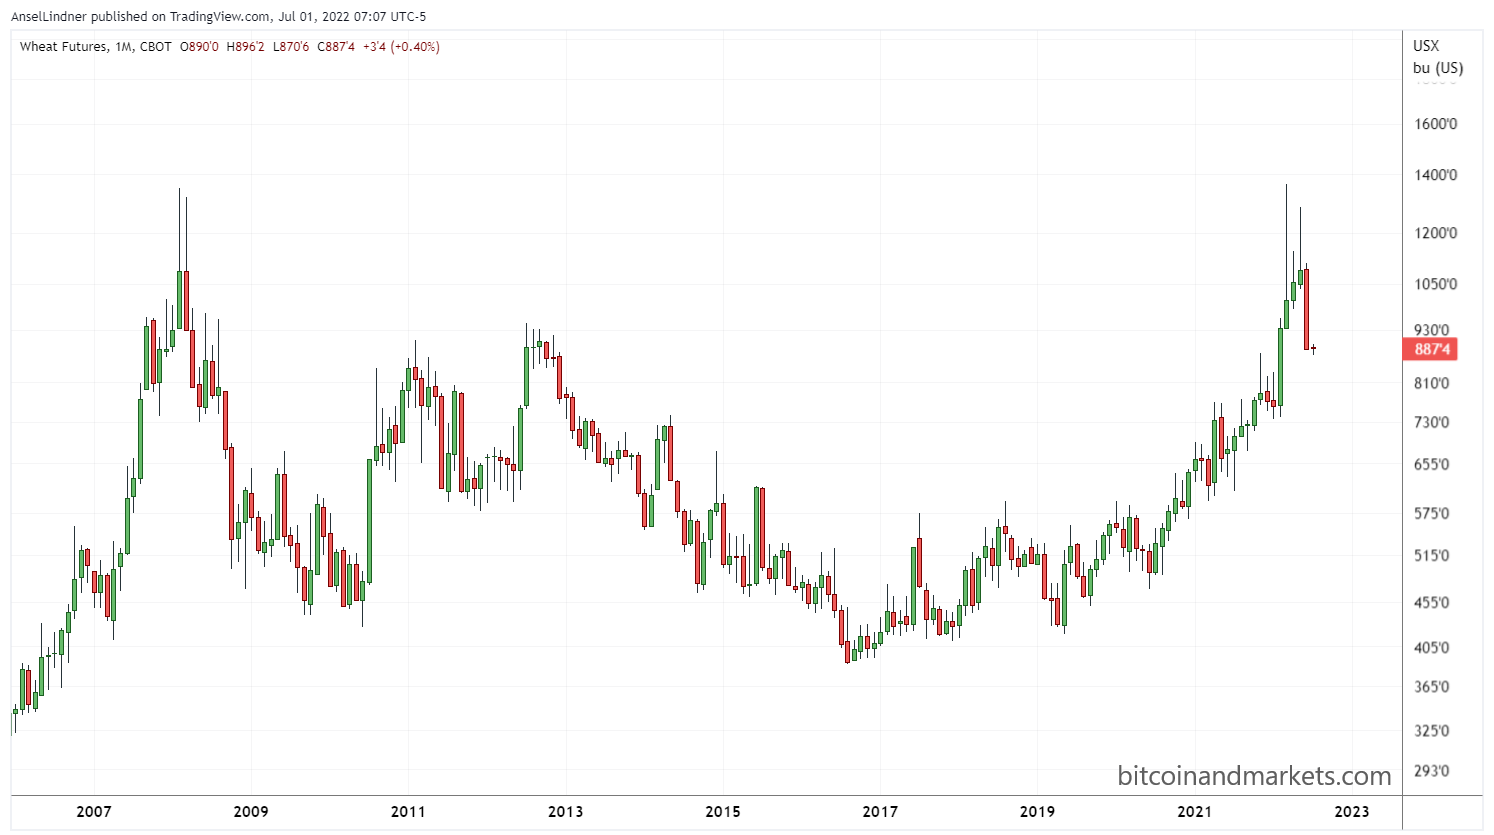
Wheat
We've heard a lot about wheat, because Ukraine and Russia are big wheat producers. But we see the same story here, too. There are now reports that the Russian wheat harvest will hit all time records this year.
The price matched the GFC and is now falling.
Copper
Macro people call it "Doctor copper" because it has a PhD in macroeconomics. What is copper futures telling us?
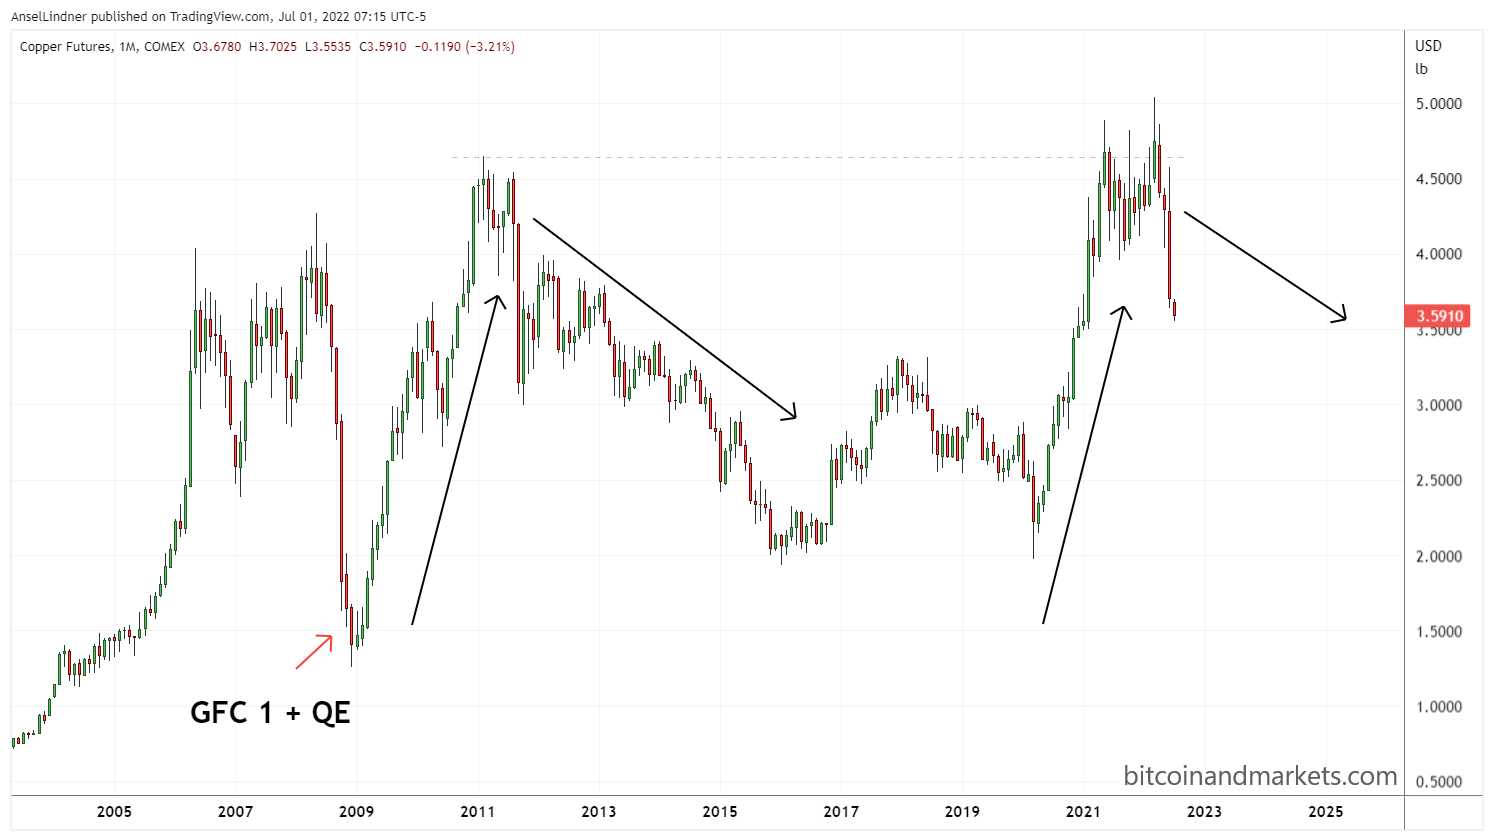
I put those arrows on the chart back in 2021. We see the same pattern as 2009-2011. Here, price did actually get slightly higher than the 2011 high, but not enough to say, "wow, that inflation was horrible."
It's a supply shock. I remember reading reports back in early 2020 during the initial corona scare, China was buying up all the copper in the market and stockpiling it. If that is the case, we could see a very rapid decline in price ahead, as they start using that stockpile instead of buying on the market.
Energy
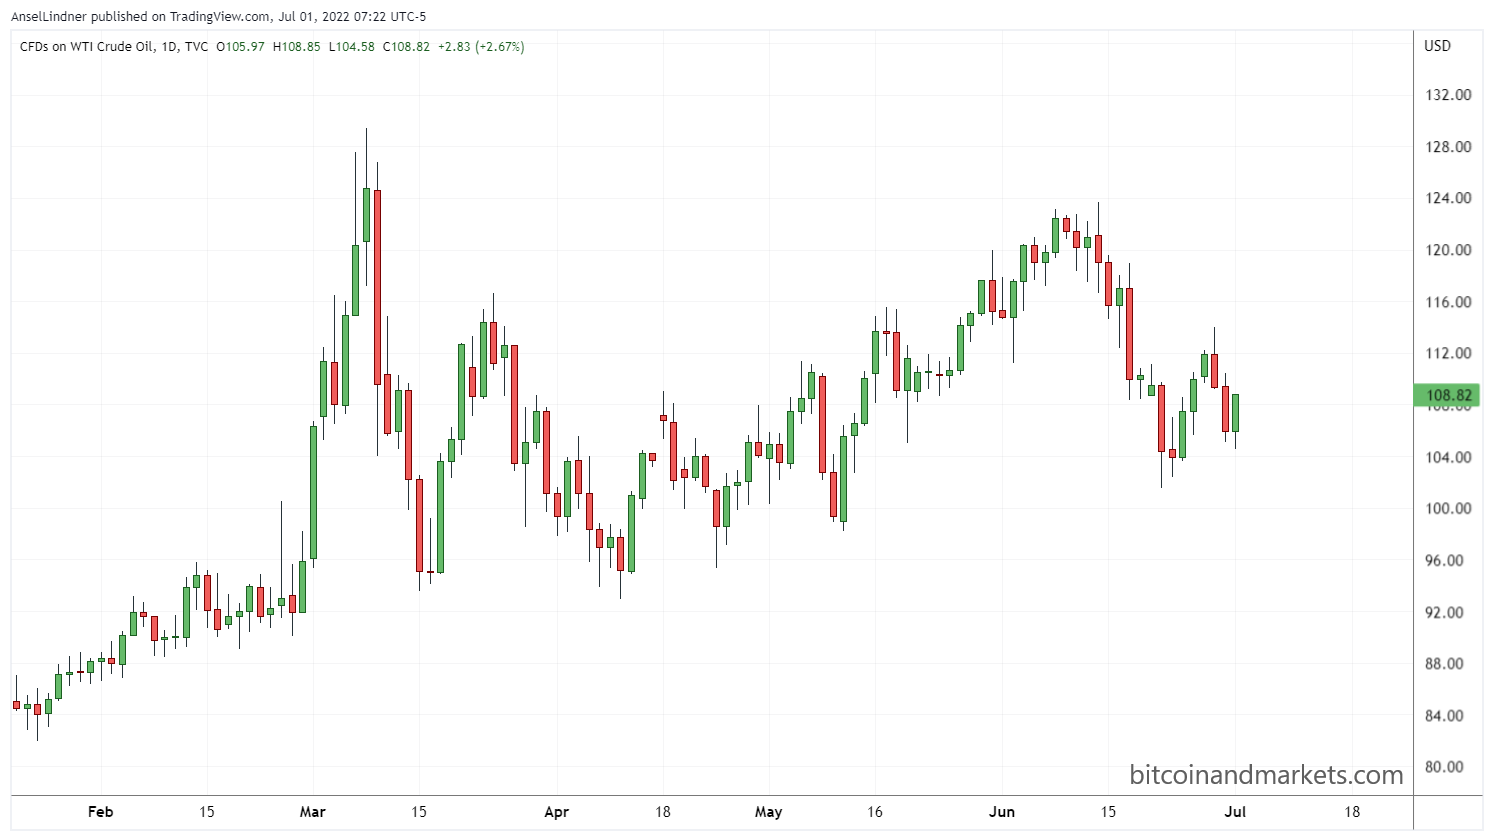
Now to the big elephant in the room, oil and natural gas. These energy commodities drive the bus on prices. How are they doing per my model?
First a naked chart. We can see that price topped on March 8th, the day I tweeted these, and the day I interviewed Luke Gromen who was selling fear of $200+/bbl oil.
Even my Uber driver thinks oil is going to $200/bbl. 🤔
— Ansel Lindner (@AnselLindner) March 8, 2022
#Oil chart looks like 2008, as the world prices in a quagmire in Ukraine. Crowded trade.
— Ansel Lindner (@AnselLindner) March 8, 2022
Now with my lines...
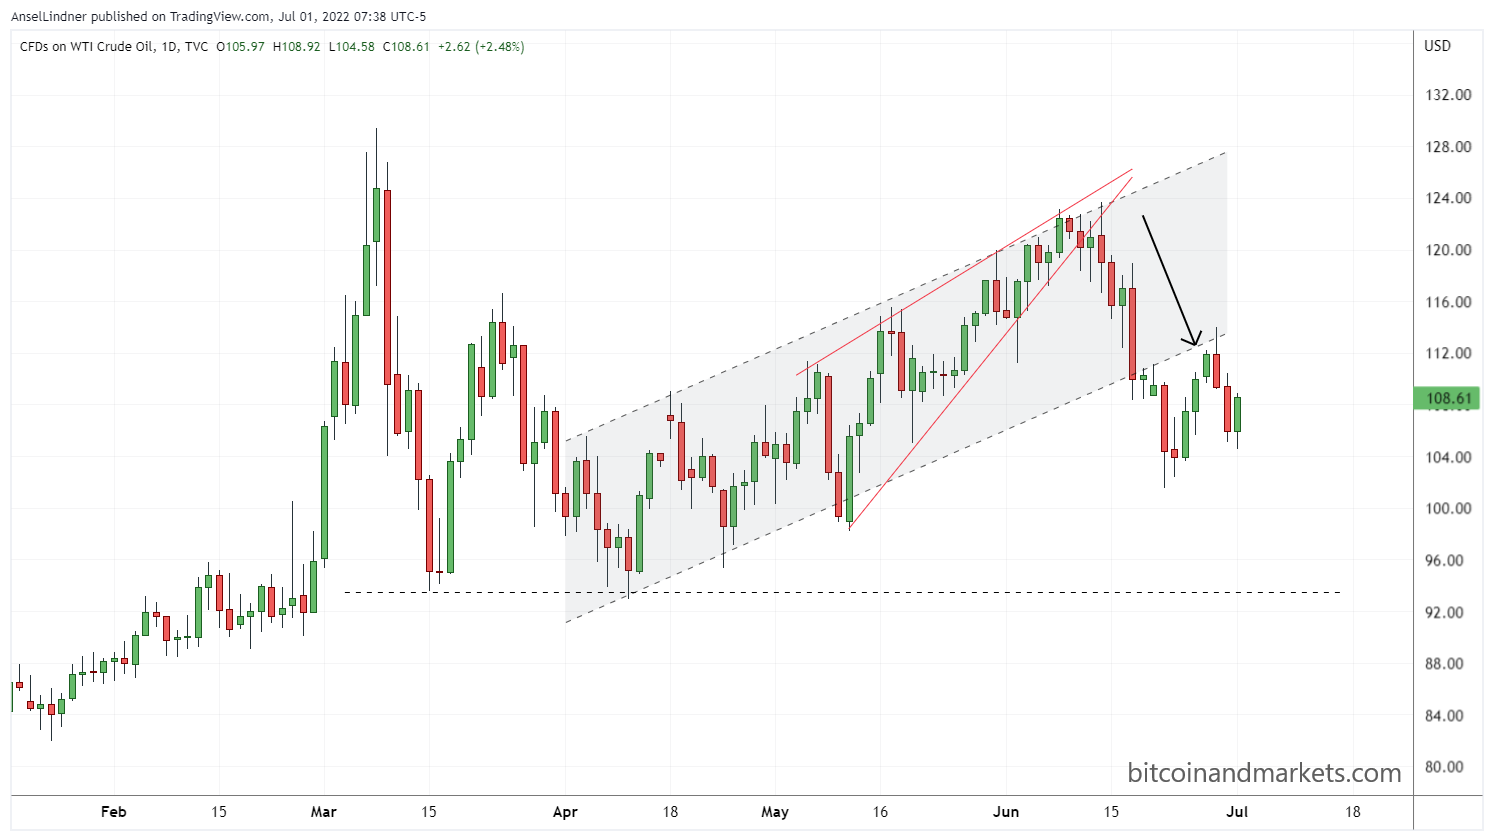
I added that arrow back when price was breaking down out of the rising wedge. In June, oil prices fell by 7.8%.
Once again, when we zoom way out, we see oil never got as high as the GFC in 2008. Gasoline prices however, are at all time highs right now, which could keep CPI high in June. CPI will start to drop quickly in the next few months though.
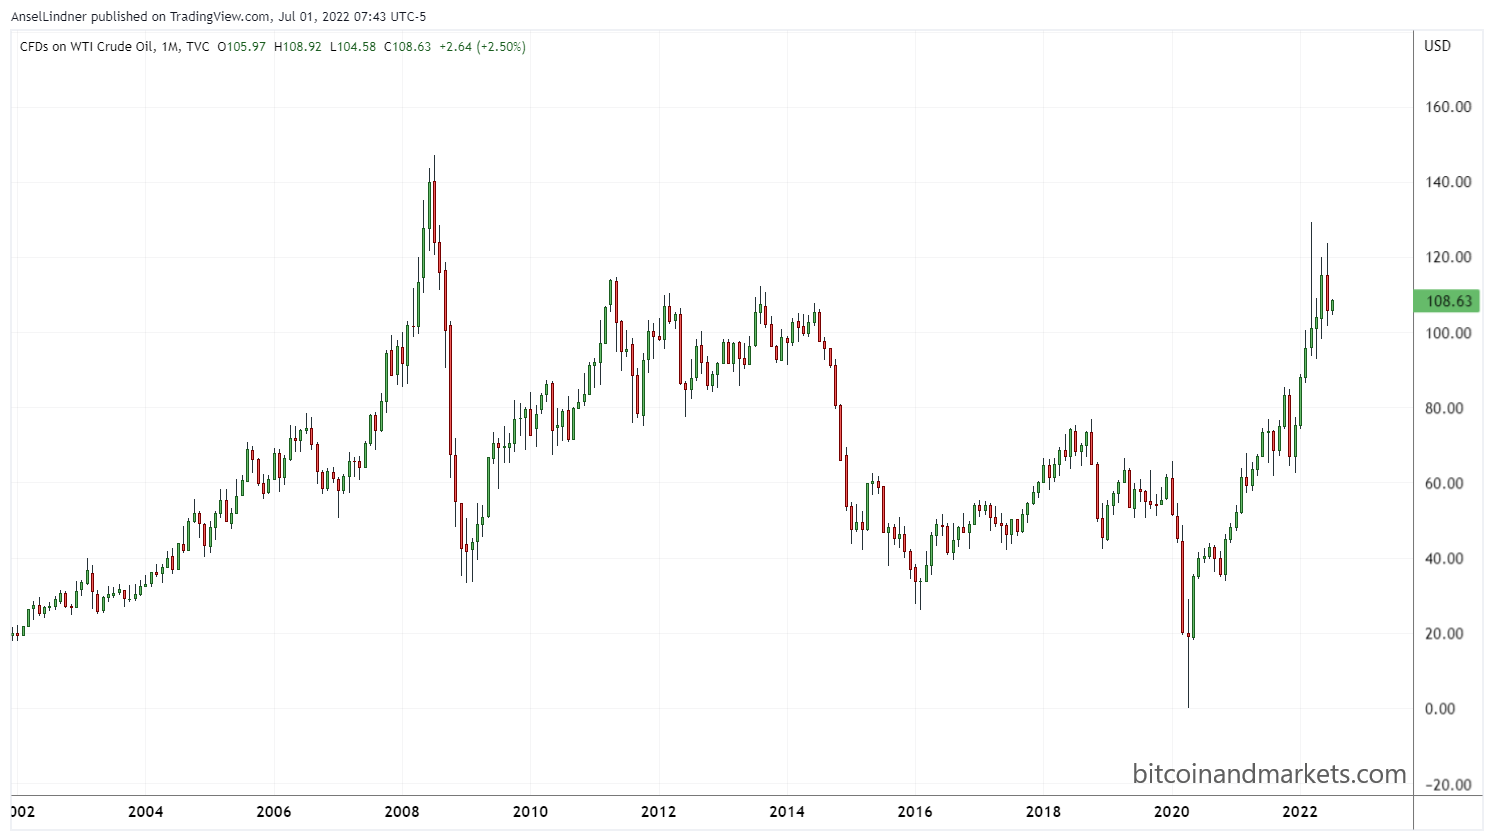
I'm not sure if this is the ultimate top in oil for this cycle, but it could be. It is improbable that oil goes above the GFC high of $147/bbl. Just look at that drop in 2009!!! If we get something similar today, a 75% drop would take the price to $30/bbl. I think $30 is more likely than $200.
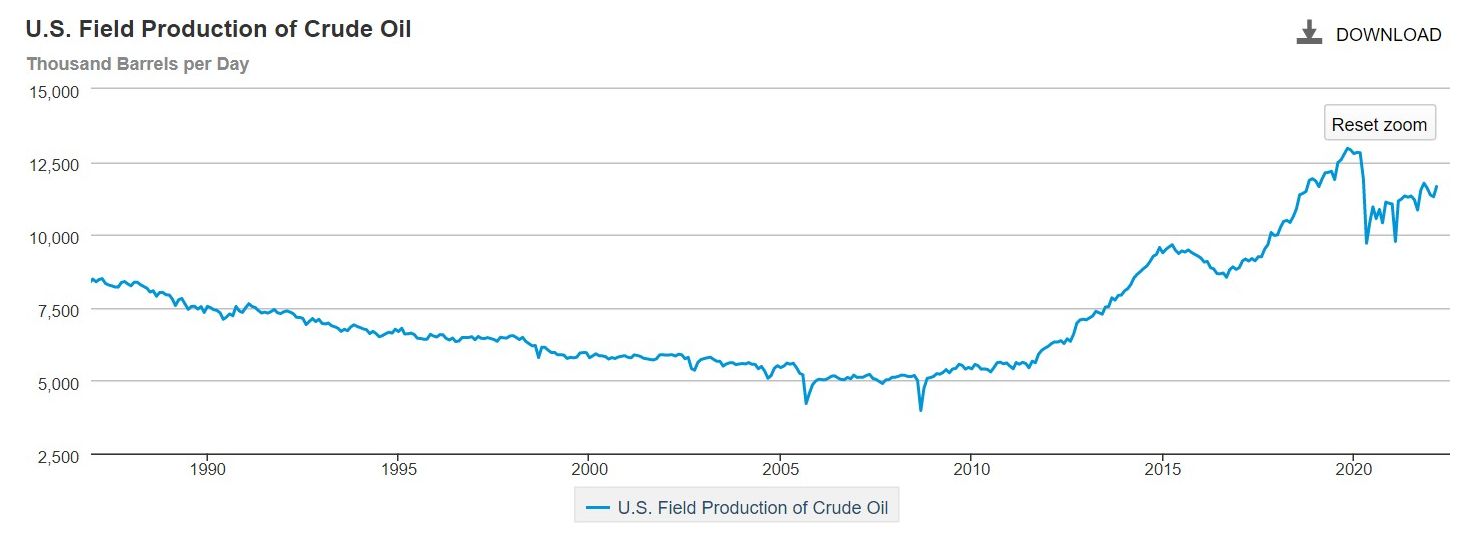
The theory behind this oil analysis is that the Fed didn't print money, we have a dollar shortage. The economy will return to normal post-GFC behavior, namely low growth and low inflation. Even with Biden fighting the oil industry like hell in the US, production here is still 90% of its all time high back in 2019.
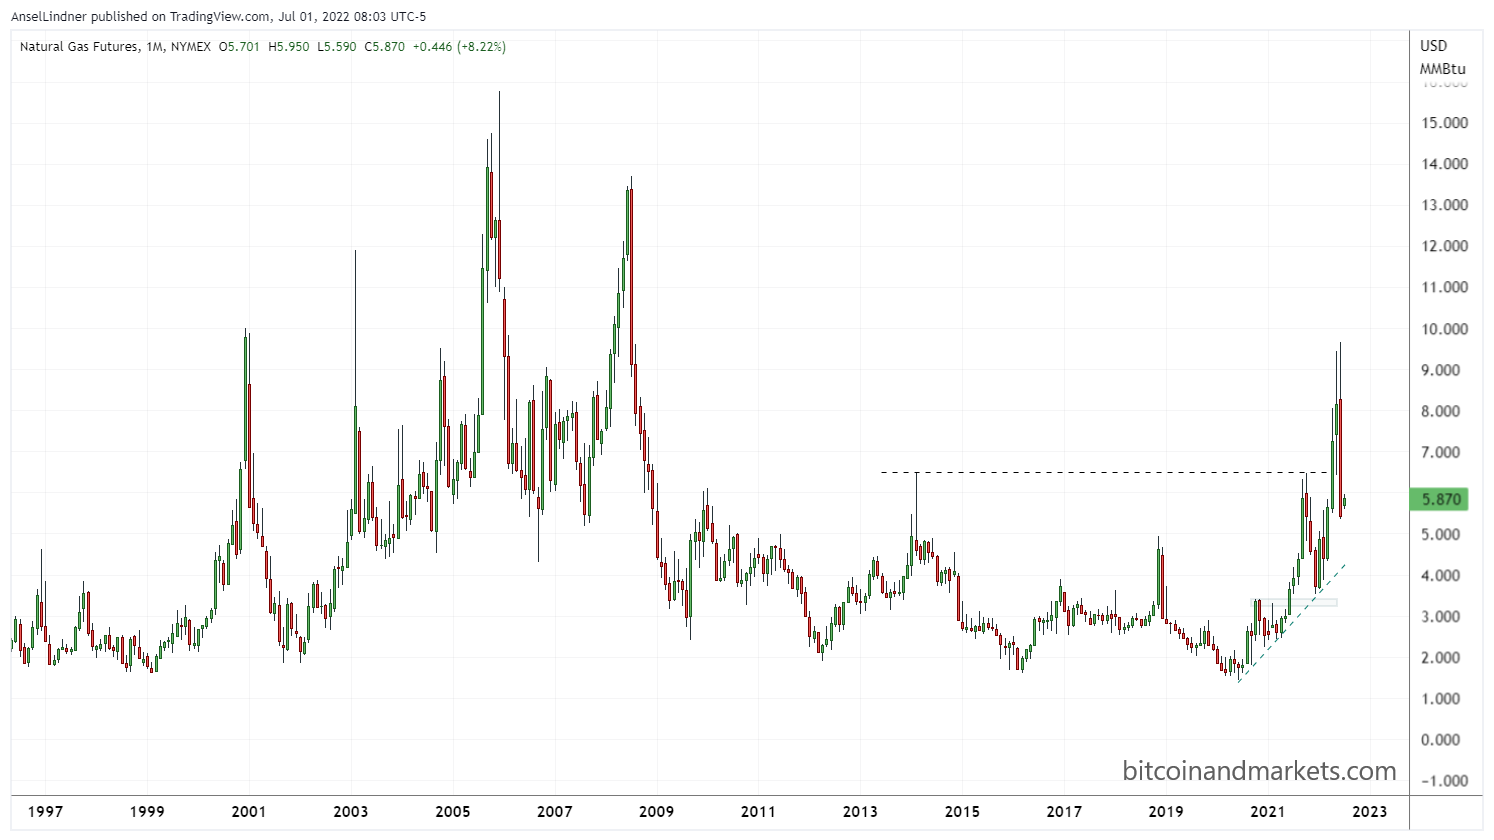
Natural gas
Europe is in deep doodoo. The first chart below is the front month futures contract, the second in the 1-year futures contract.
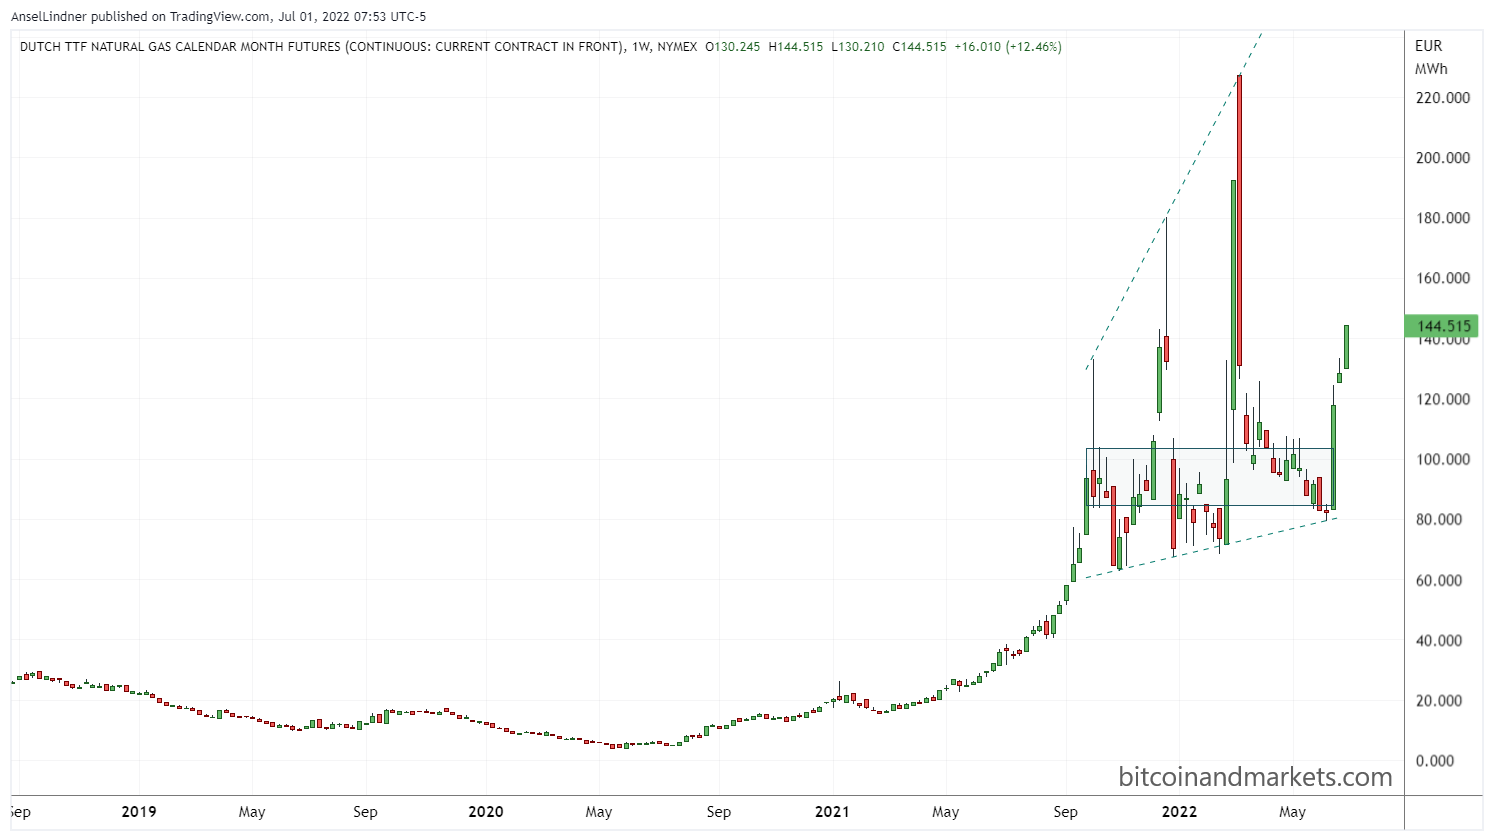
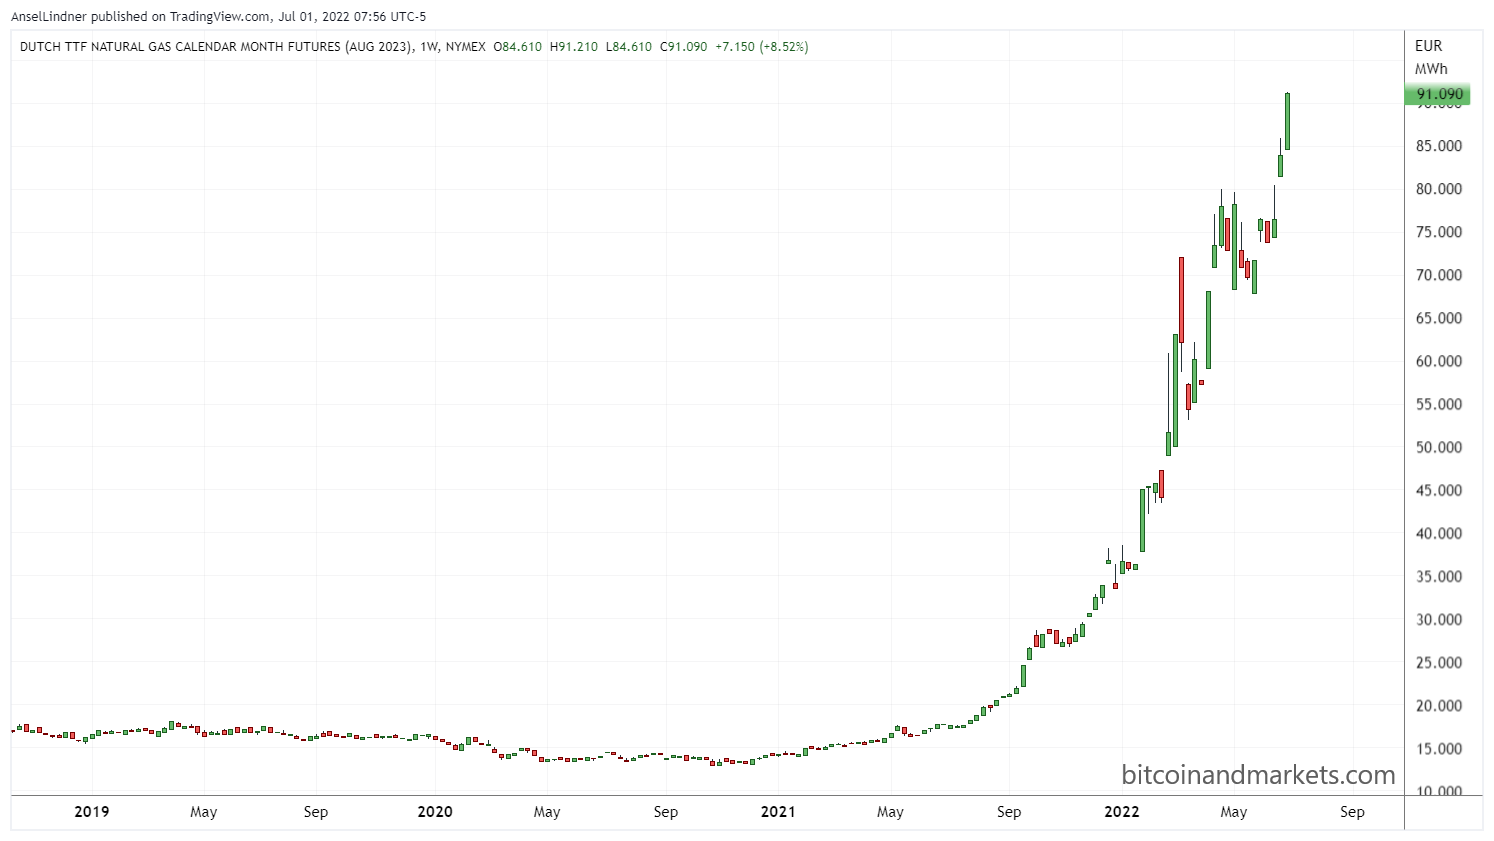
One thing you'll notice is that the front month contract is up at €144, while the 1-year contract is only €91, but is going up fast. I think most people thought, like I did, that the Russian war would be over relatively quickly, and trade relations could return to normal by 2023. Now, they aren't as sure, so 2023 prices are rocketing higher.
US natural gas
The US is the largest natural gas producer in the world. Let's take a look at our domestic prices. Looks kind of similar, however, prices have been coming down very quickly in the last couple of weeks. What if we zoom out?
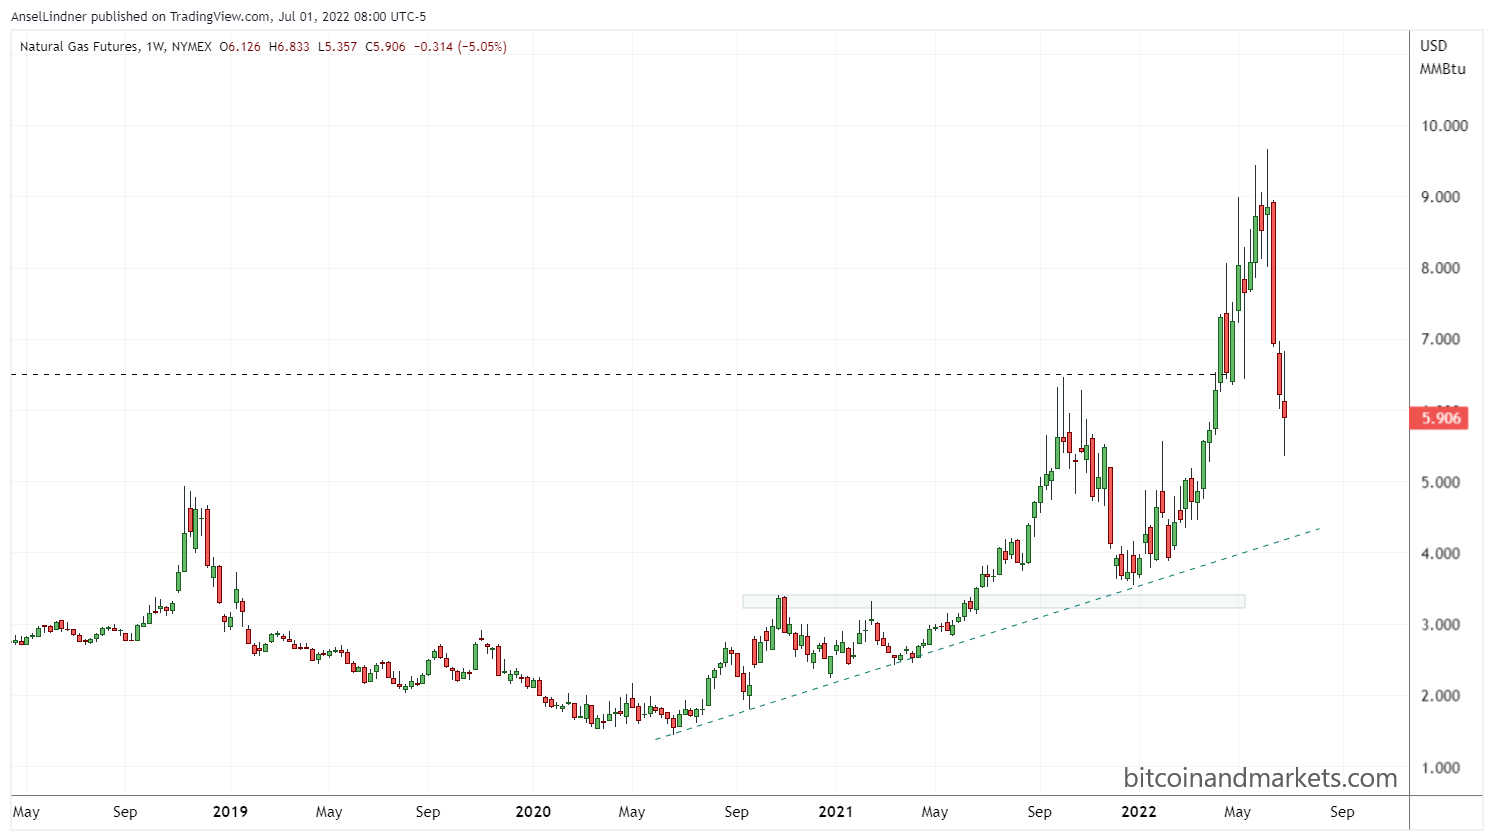
Although the European gas prices are at all time highs and very scary, if we put US natural gas prices into context of the GFC, it's a big nothing burger.
To wrap up: the recent "inflation" has been mostly driven by supply shocks and oil shocks, not money printing. The charts of commodities show us that. All the agriculture commodities, if you zoom out, do not show crazy high inflation, metals and energy, tell the same story.
The Fed is going to have to follow the market into recession like they always do, by cutting rates and starting QE. Europe and China are in horrible shape, much worse than the US.
Cheers,
A