Macro Update - 20 May 2022
Macro update of currencies, the dollar and euro, commodities, oil, gas prices, CPI and monthly CPI.
Markets do not go up (or down) forever in a straight line and paradigms do not shift in parabolic moves. Whenever you see a parabola in a chart, there is a reversal coming. We can't say exactly when, but parabolic moves always end in return-to-normal reversals, and usually in crashes. That goes for bitcoin, bonds, commodities, currency, stocks, you name it.
Even if the US bears are correct, there will be consolidations along the way. However, I do not think the US bears are right. Sure, there will be some short term pain, but it is far from a paradigm shift. If the US economy is humbled by say 10%, it remains the largest, most powerful economy in the world.
We do not live in a fixed pie world. If the US is humbled, it does not follow that some other country rises. Indeed, it is much more likely to mean other countries are brought even lower.
Dollar is Still King
The US capital markets are the largest in the world by a massive margin. It is home to 41% global equity markets and 40% of fixed income markets, the US dollar accounts for 60% of foreign exchange reserves, 80% of global export invoicing, 60% of foreign currency debt, and nearly 100% of central bank swap lines.
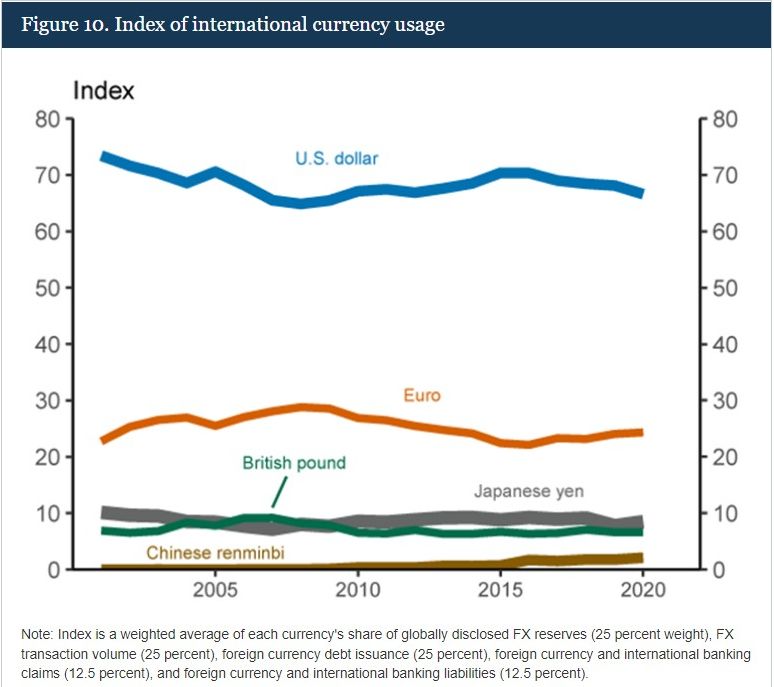
On top of the dominance of the dollar, you have to look at the alternatives (other than bitcoin years in the future). The second place currency, that comes in at about a 20% of each category, is the Euro. And it's in a existential crisis.
Where else is the capital of the world going to flow? Yes, some will come into bitcoin and bitcoin will definitely benefit from collapsing currencies, but most of it will go into the dollar and dollar denominated assets. Just think, where do the Chinese want to hide money? They buy US property. Where will European capital flee to as their Union and currency collapse? Definitely not Russia or China. The US again.
Okay, we have those bases covered. Now, let's look at some charts about the macro situation and see if we can identify whether the recent moves, say over the last 6 months, look sustainable and a new paradigm?
Yields
A 40-year history of the US 10Y Treasury yield.
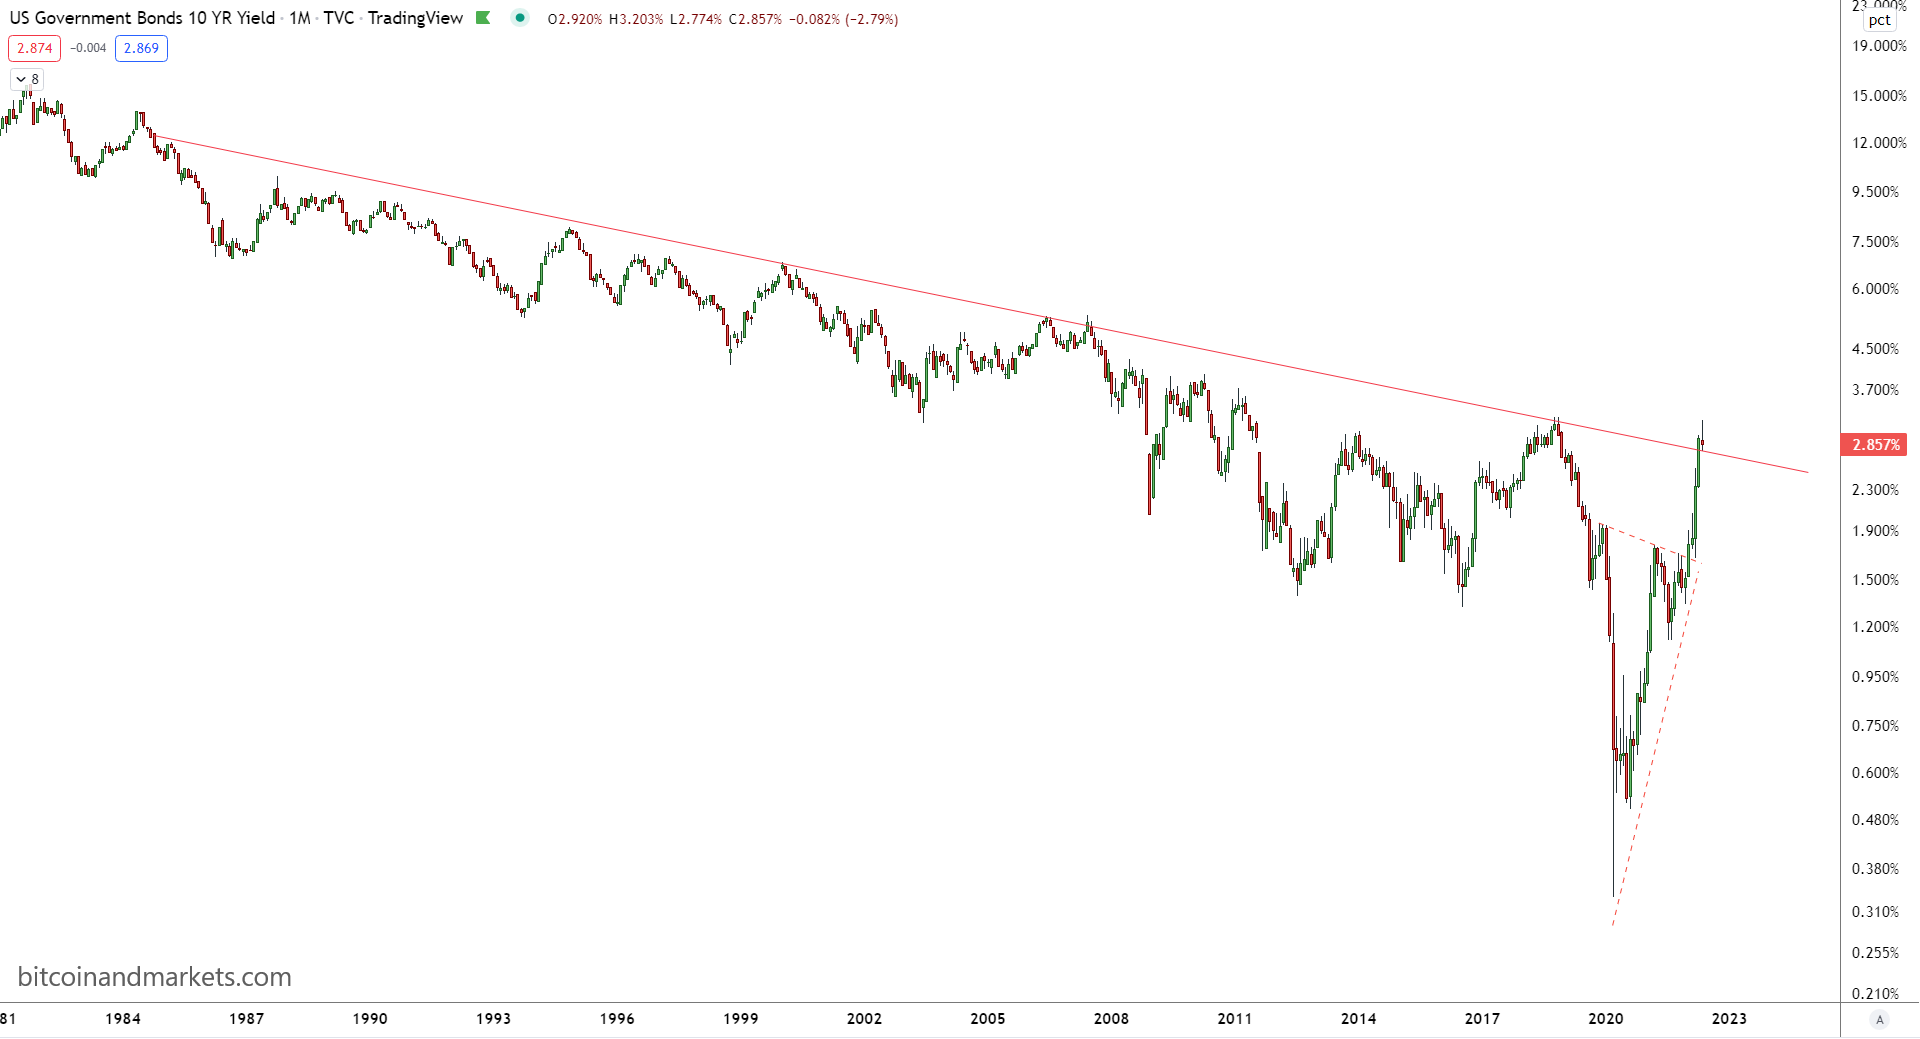
The reflexive snap back to the trend line is impressive, but this is far from a paradigm shift. Many people say that rates are so low, they only have one way to do, and that's up. I'm sorry to tell those people, put their charts on logarithmic scale. Even if something has gone down 99%, it can still fall another 99%. Just look at Terra.
The US 10-year Treasury yield could easily continue this logarithmic trend for 5-10 more years. My argument is that it will continue until there is a viable alternative, and that's not Chinese government bonds, duh, it's bitcoin. It will take those 5-10 years for bitcoin to mature into the viable alternative.
Here's a closer look at the 10 year yield.
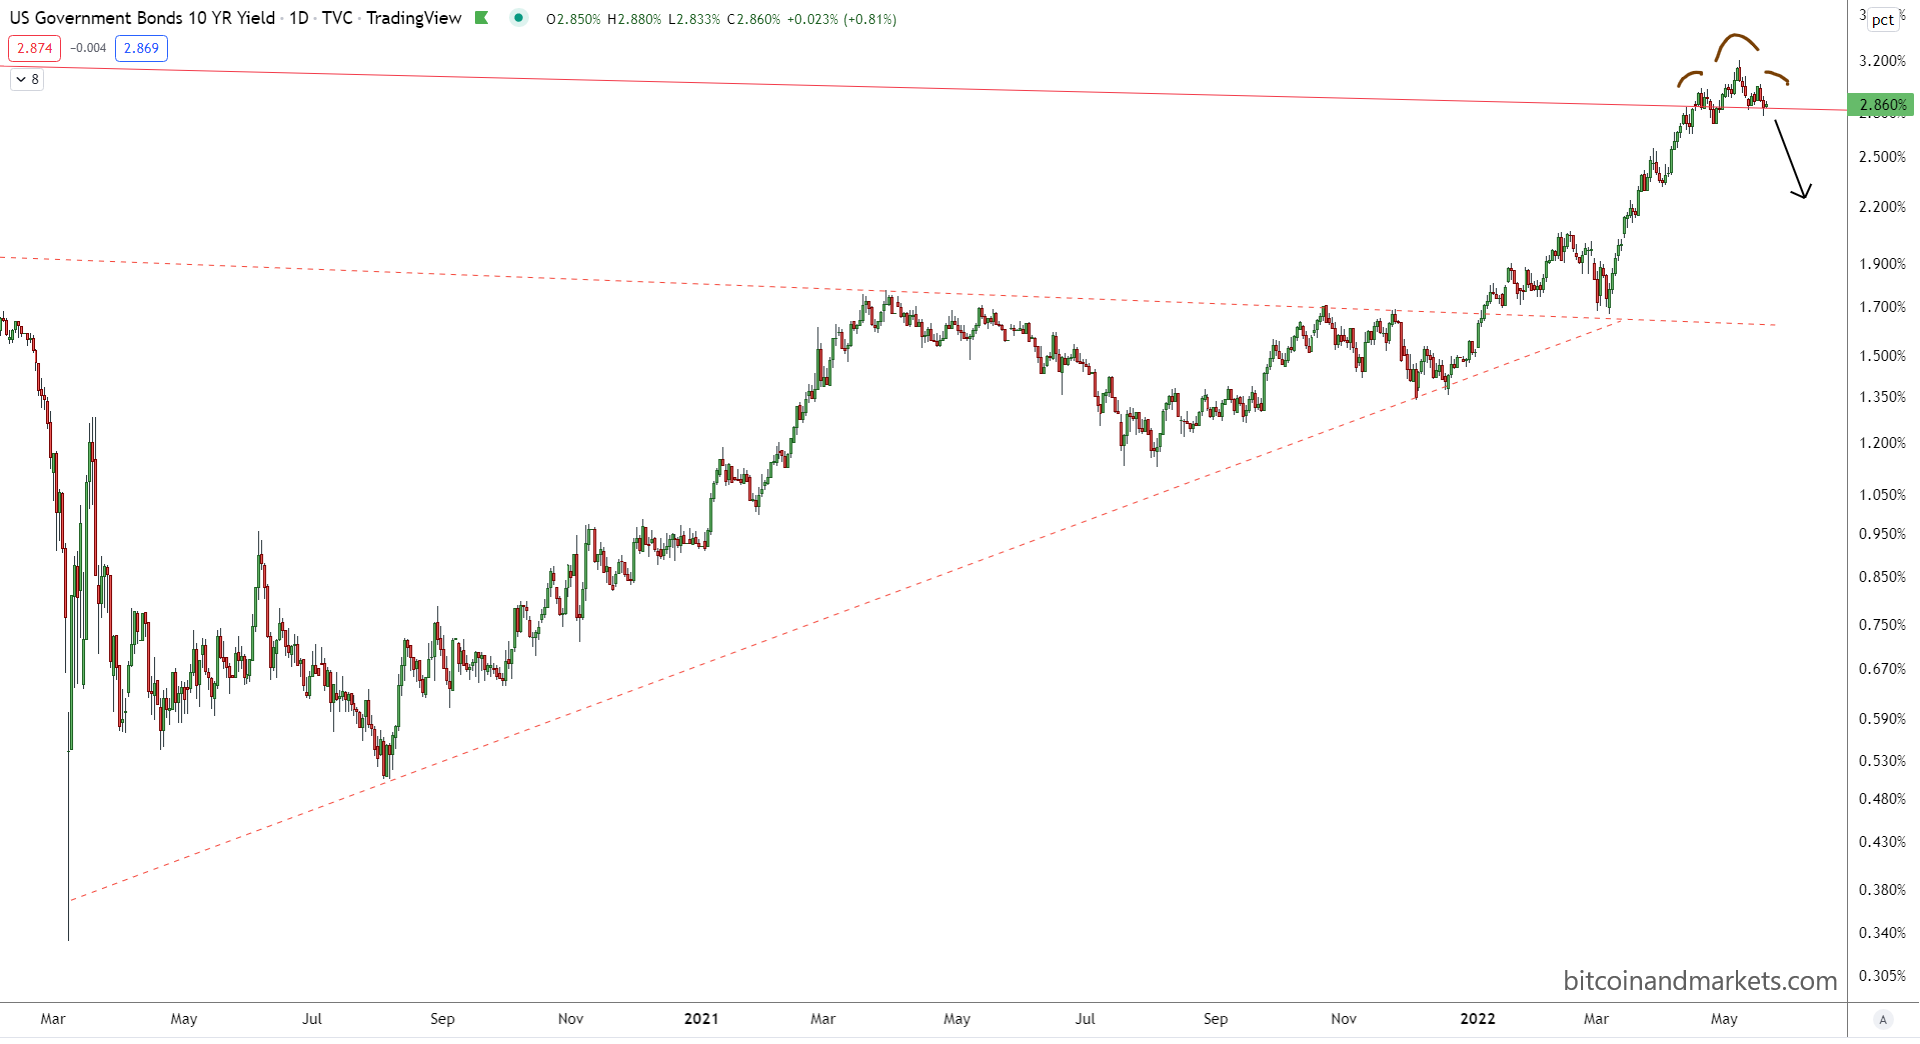
Zooming into the last 18 months, it is looking like a head & shoulders topping pattern. Technically, the goal for this pattern is down the the height of the pattern. In this case, the height of the H&S is roughly 45 bps, so a breakdown target would be -45 bps from here, 2.30-2.35%.
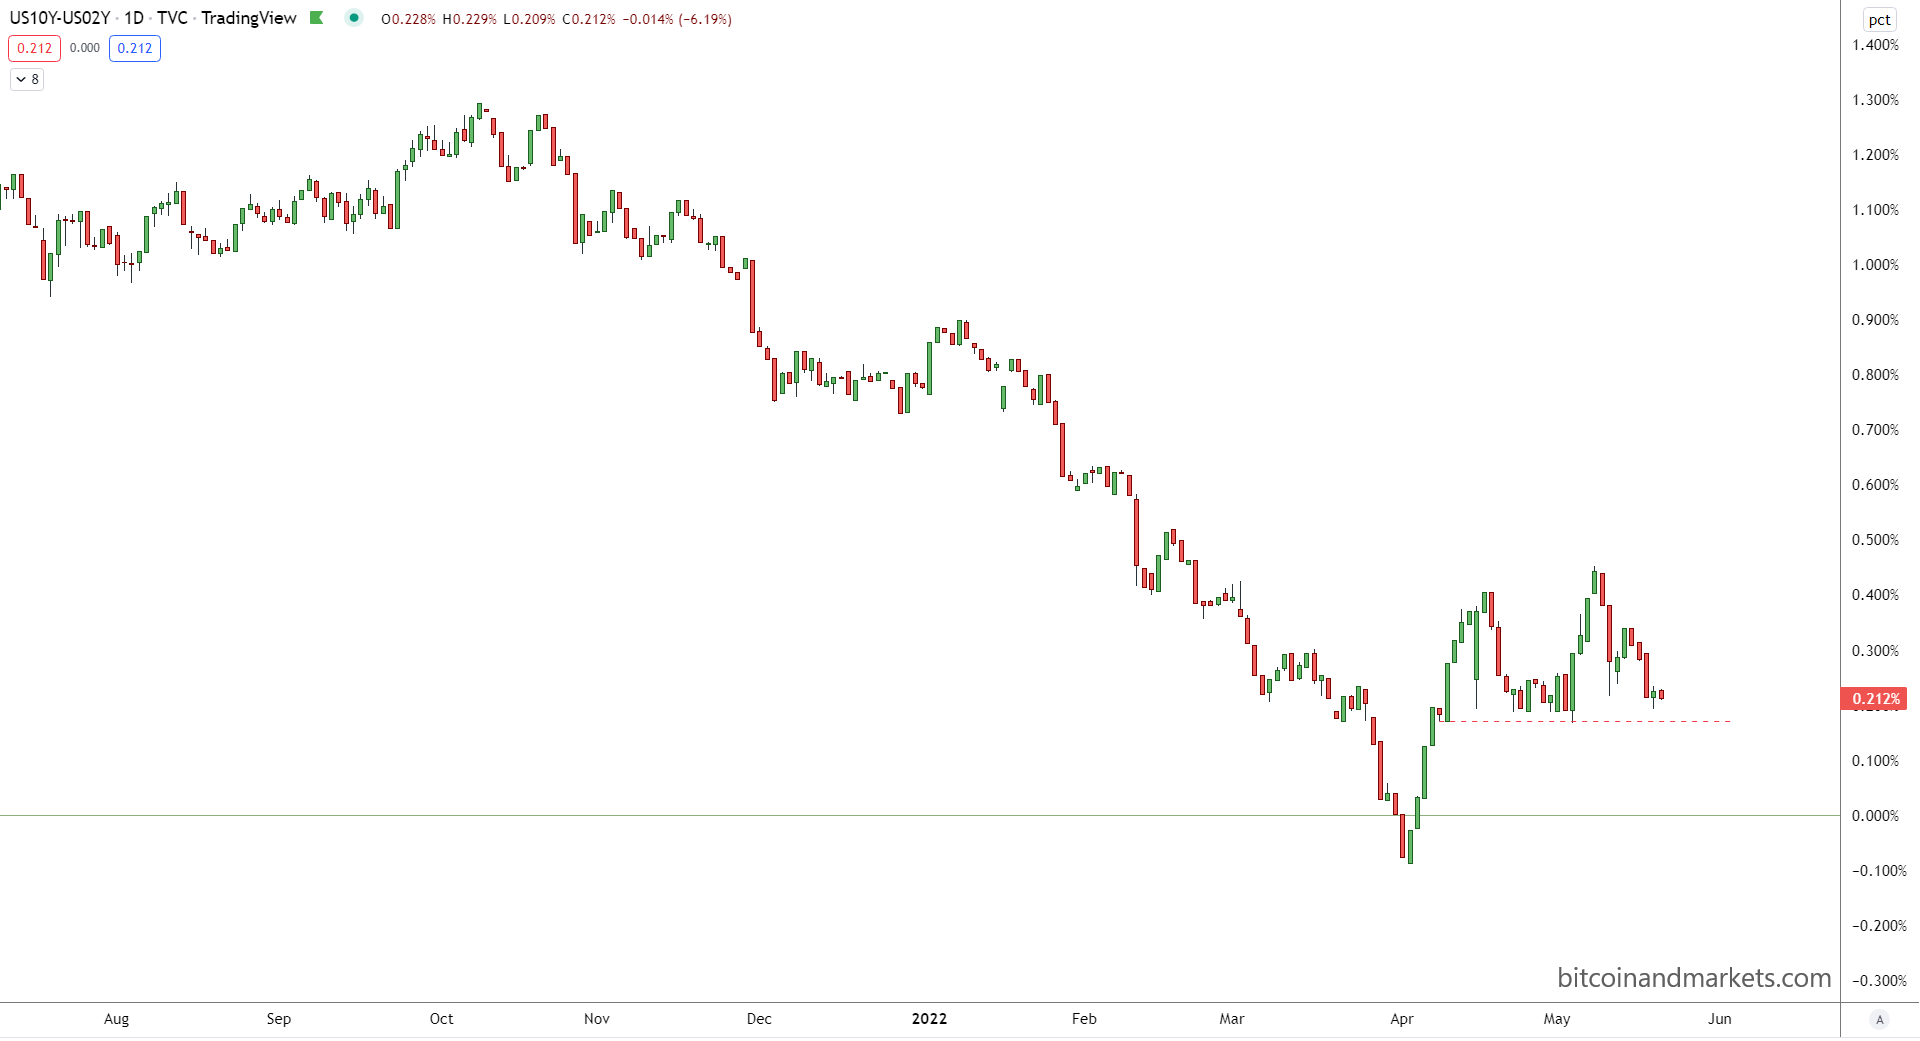
The 10Y - 2Y curve is also flattening again. It is close to breaking lower. This signals stress in the system, and financial entities are going to run for the safety of US Treasuries.
Dollar
We find another parabola in the DXY. This is the dollar index versus other major currencies, mainly the Euro (58%), Yen (14%), Pound (12%), and Canadian dollar (10%).
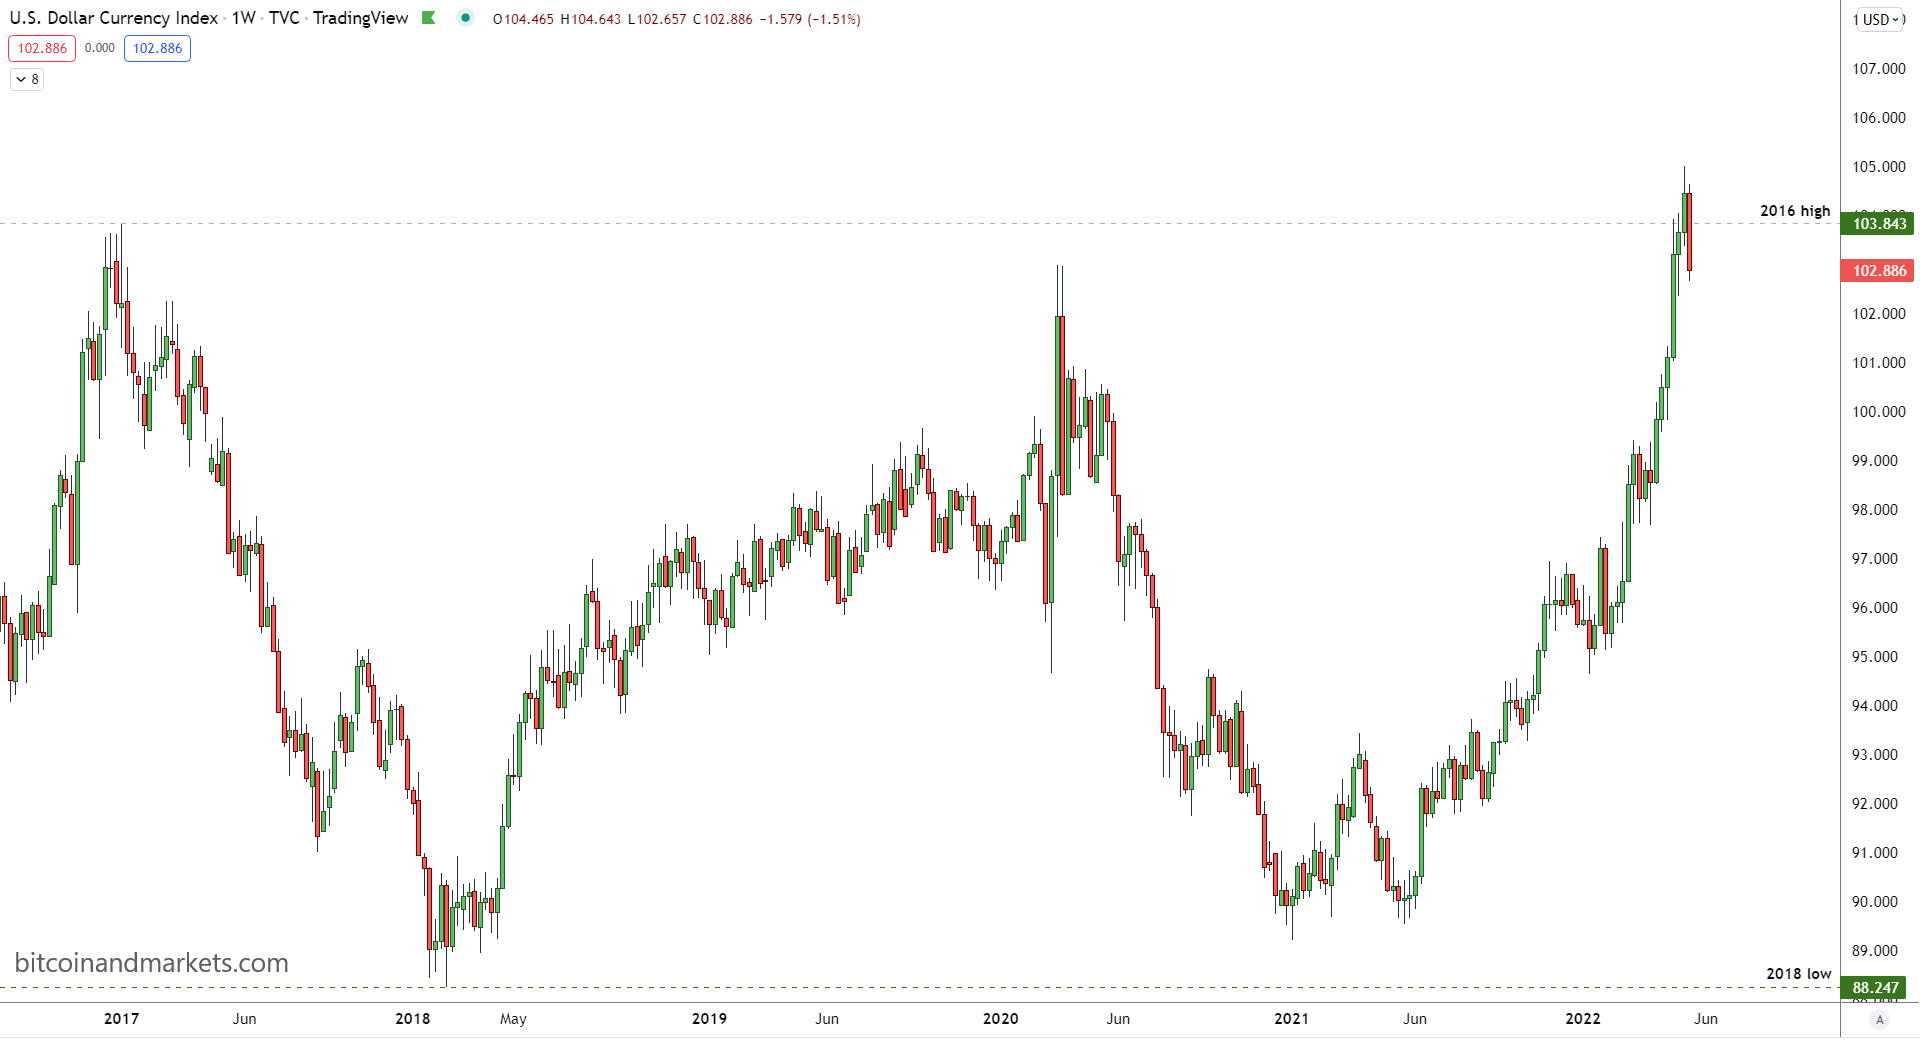
While I've been a dollar bull for years now (perhaps the only dollar bull in the bitcoin space!!), nothing goes up like this for long. Yes, the DXY can still go higher, but it looks as though it has topped for now. I think it's time for a consolidation to around the 100 handle or lower.
If the DXY is too narrow for you, we can also look at the trade-weighted dollar. This is a measure by the Federal Reserve that takes into account foreign currencies by trade volume. It importantly includes China (15.8%) and Mexico (13.5%). I wrote a great explanation here.
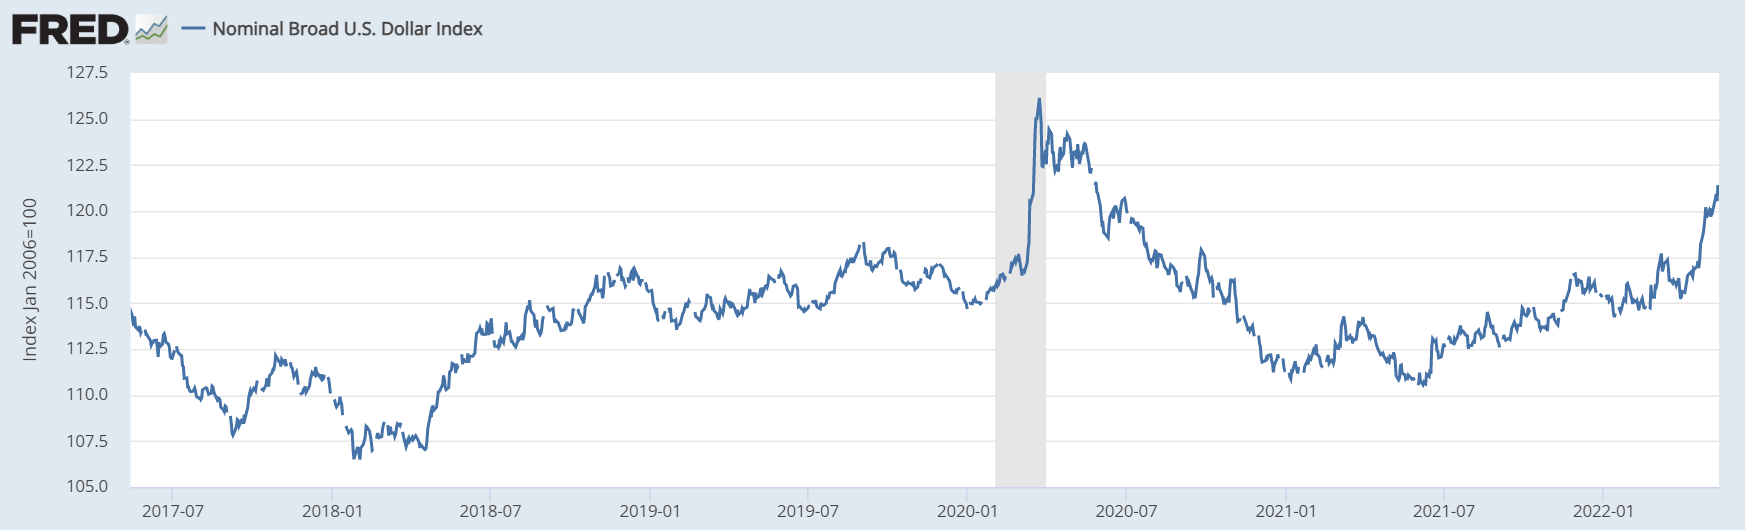
As you can see above, the trade-weighted dollar index has also hit a 2-year high. It is breaking above the pre-covid levels that were themselves heavily stressful for the global economy. But there is still room to rally higher on this chart.
Something is going to break from the strong dollar and soon. It could be an emerging market currency, or some sort of emerging market financial crisis. That is very bearish for the rest of the world, not so much for the US. Again, the US is relatively more attractive for capital.
Commodities
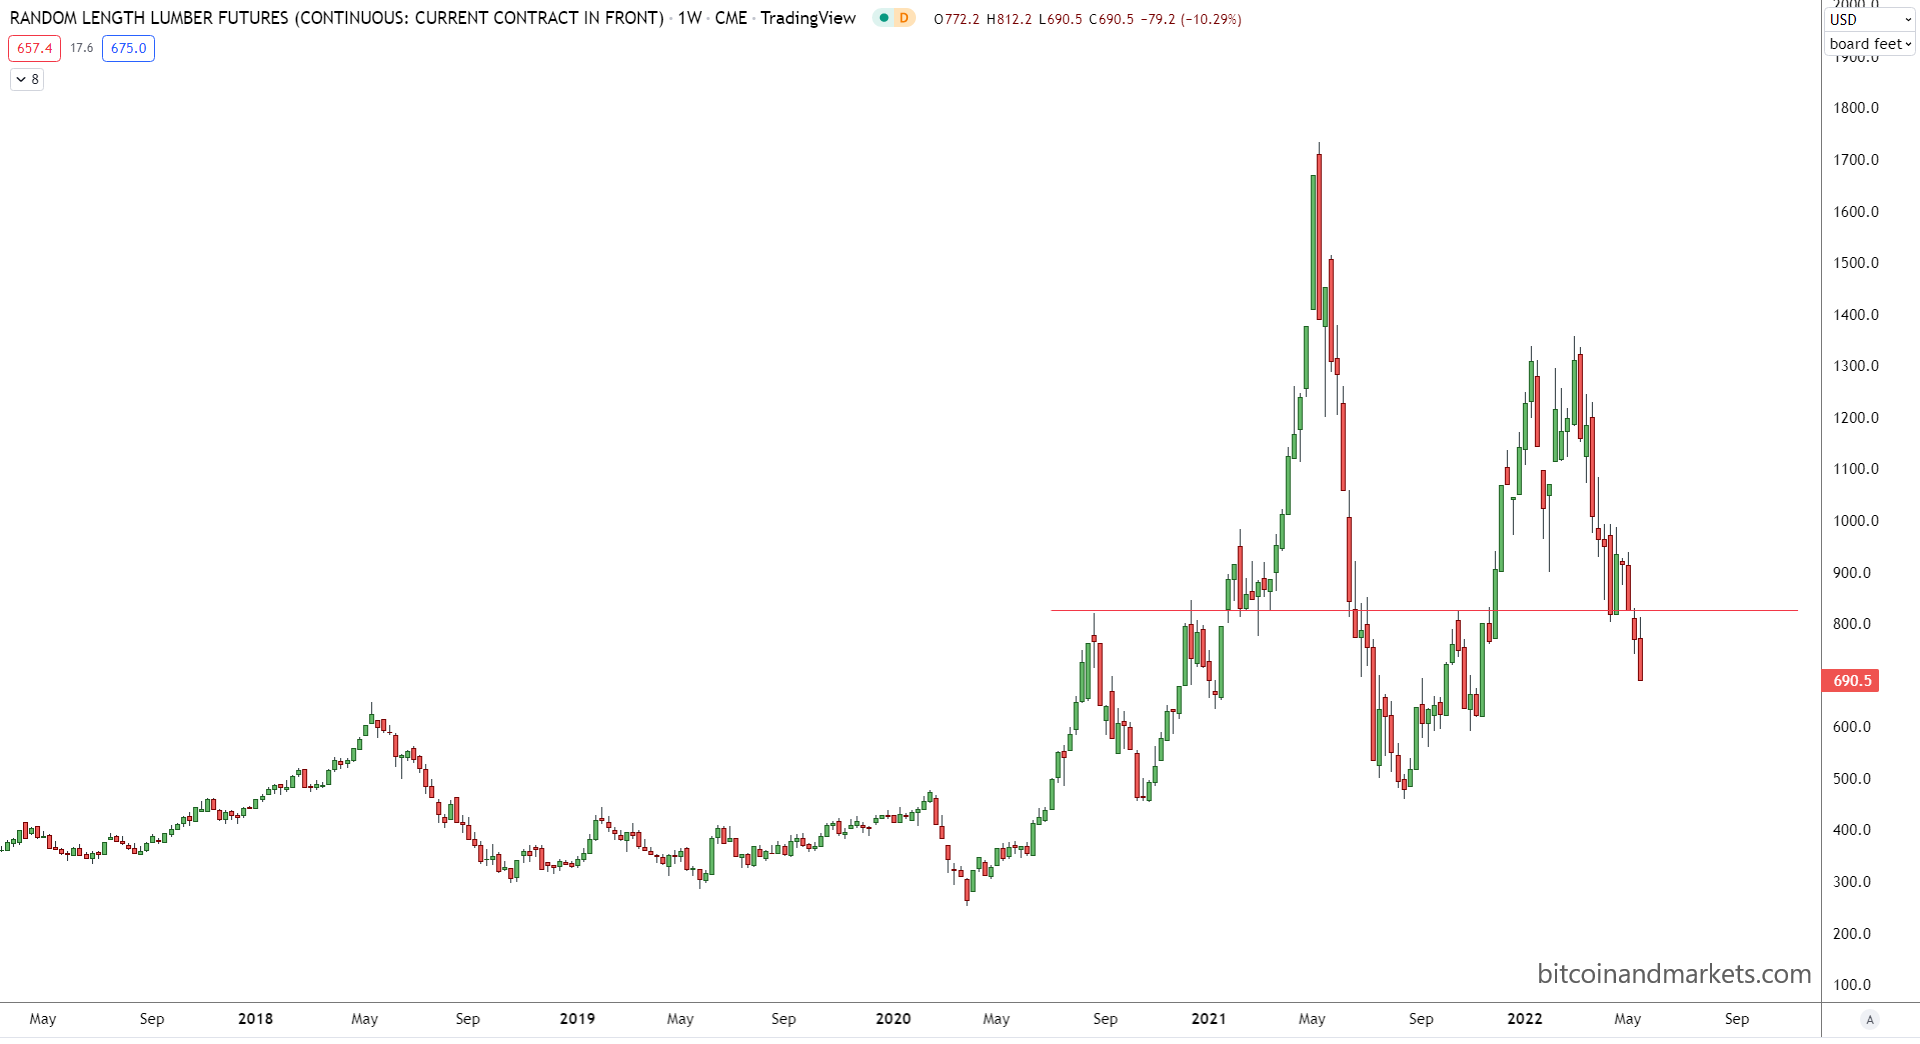
We hear a lot about lumber prices being very high and causing stress for home builders in the US. Well, those prices are crashing, recently breaking an important support level.
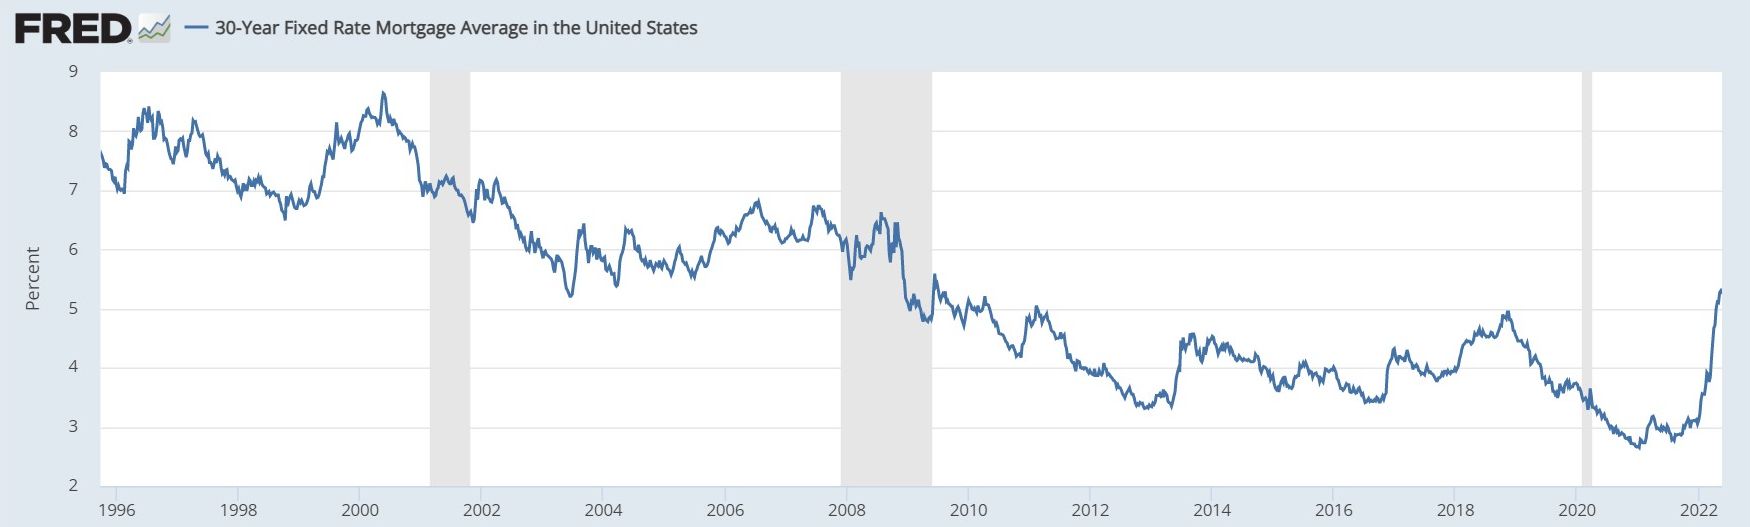
This could be due to a slowdown in housing, but that doesn't necessarily mean a crash in home prices. Rising mortgage rates are the same. They will lead to reduced volume, but prices might not be broadly affected, unless rates remain high for a prolonged period.
Don't forget either, that average mortgage rates do not affect homeowners with existing fixed rate mortgages, only new loans/refinancing, which if they are down in volume will only affect this average less.
And I'll point out a very important overlooked fact, that with fewer refinancings and initial home loans being made, fewer dollars are printing (in the actual way they are printed) by the banks. This is actual deflation as the rate of money printing vs money destruction falling.
We looked as lumber, what about commodities more broadly. I'll look at a commodity index and, that most important of commodities, oil.
First, a monthly chart of the Goldman Sachs Commodity Index (SPGSCI).
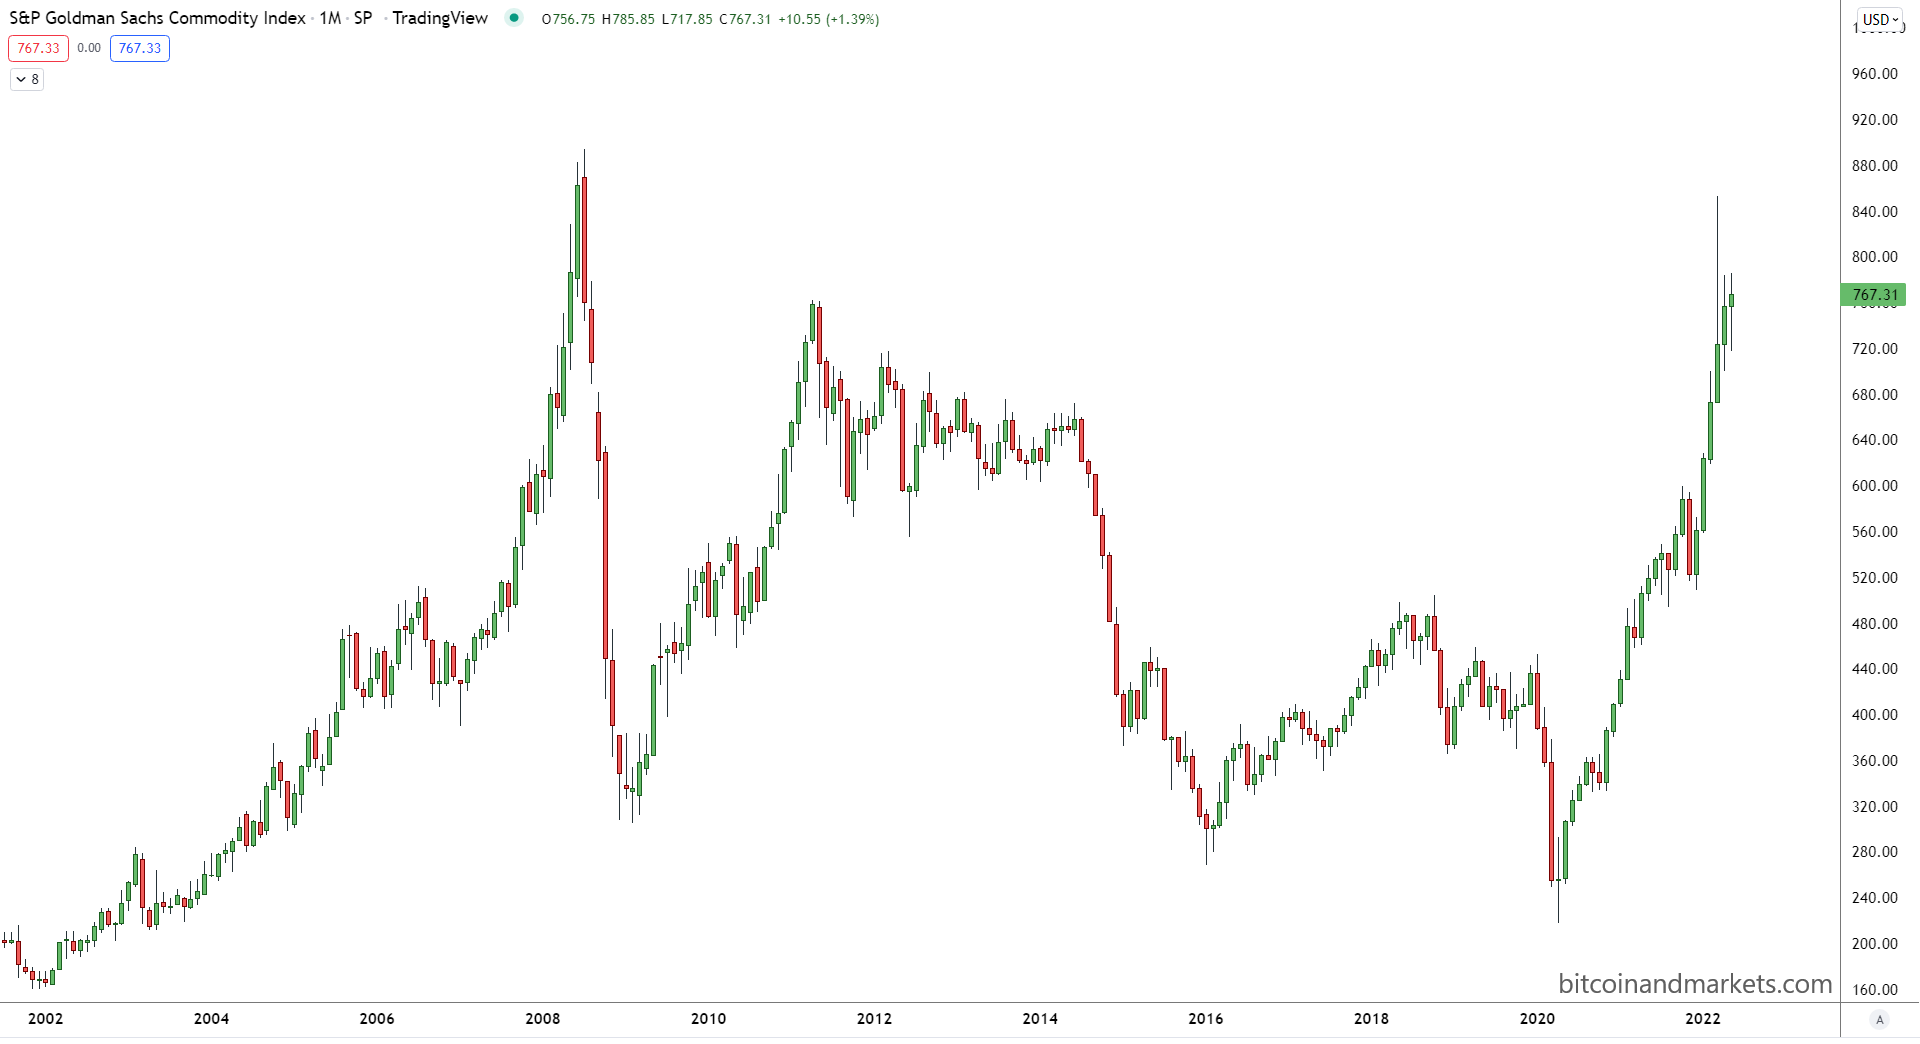
Huge parabolic move again. Wow. Does this look sustainable to you? Zooming in...

The commodities index has a really big rally on the Russian incursion into Ukraine, but since hasn't panned out. I think we reached the max number of buyers, and as the Ukraine outcome gets more and more certain, this will collapse. It was over done and is hanging on uncertainty of worse economic fallout from that conflict.
Okay, now the granddaddy of all commodities, oil. Here is WTI (West Texas Intermediate)... It's very similar to the commodity index because oil is such a huge part.
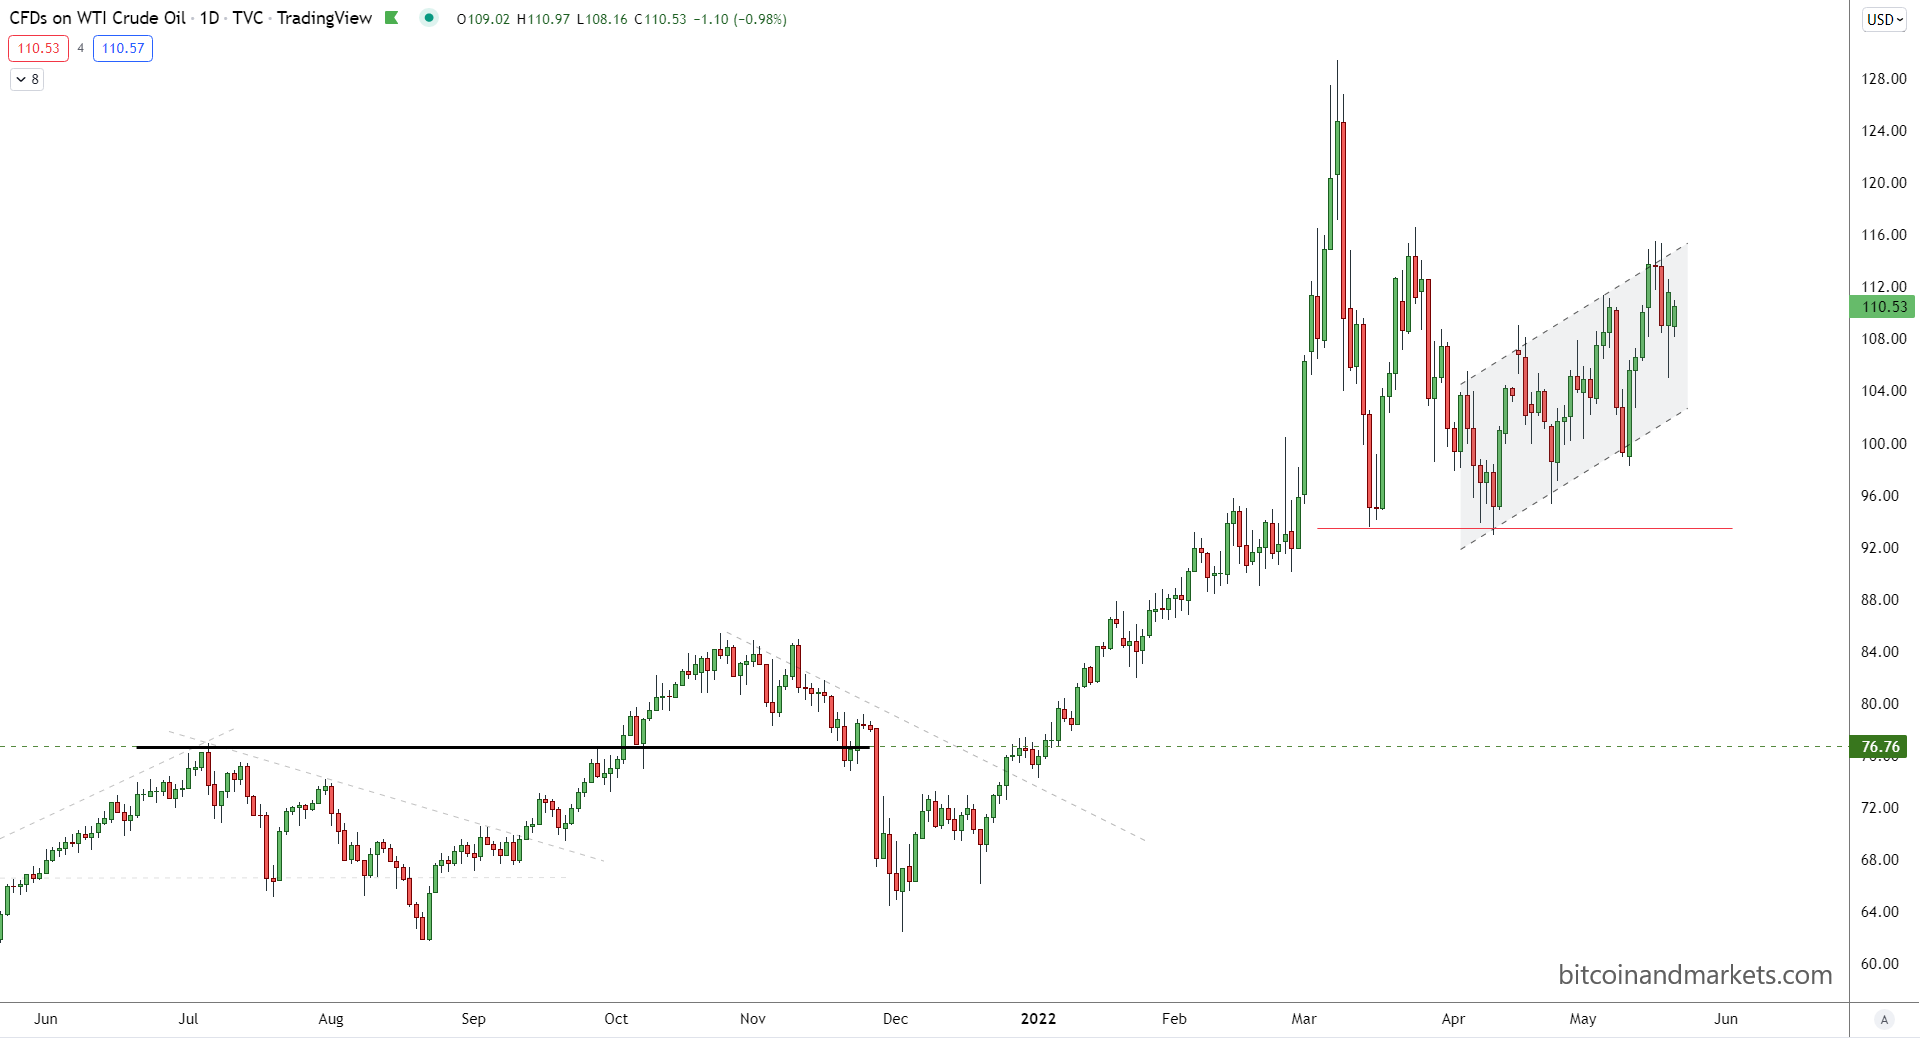
What I see above is a price scare at the opening of the Russia/Ukraine conflict and no follow through. What I mean by that is that demand is falling. There is no follow through on demand to keep pushing the price up.
The price of oil could keep ticking upward here, but I think the odds are for a downside surprise. The EU caved to Oil for Rubles, and the more uncertainty over the situation there could get wrapped up very soon.
If Russia completes and consolidates its current gains in the Donbas and the south, they could offer a peace that allows Ukraine to keep Odessa. I know, that's a surprise. But it's also a carrot to wrap up peace talks. Anyway, that's just an example. If the conflict in Ukraine slows down or turns cold, commodities and oil will crash. And the charts support that conclusion.
Check out US gasoline prices. Again, we see a parabola..
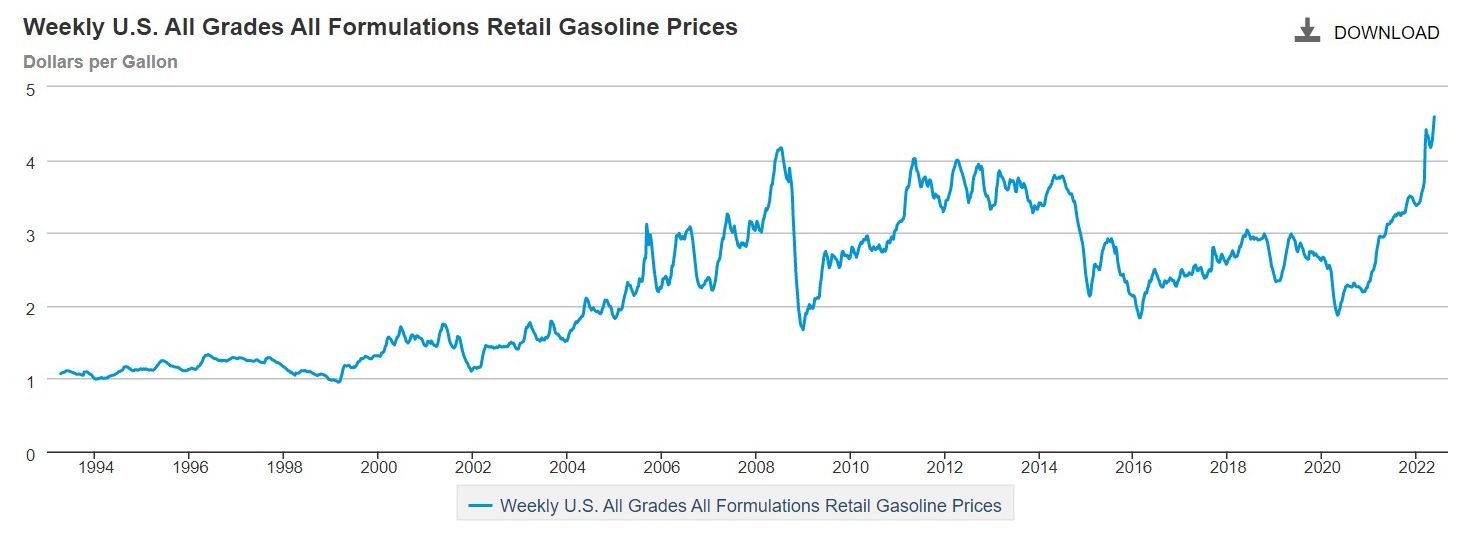
The thing that people do not get about gas prices, they simply cannot keep going up. As price rises, demand falls. It gets to a point that further price increases are only met by offsetting demand declines.
Where is that point? I suspect it's around $5-6/gal average in the US ($7-8 for diesel).
CPI
Lastly, let's look at CPI in the US. What I did below was take the monthly rate (MoM) and annualized it. What we are typically used to seeing is the Year over year rate (change in prices from this month last year). So much nuance is lost in that YoY measure.
So here, I show a more responsive CPI of annualized monthly "inflation".
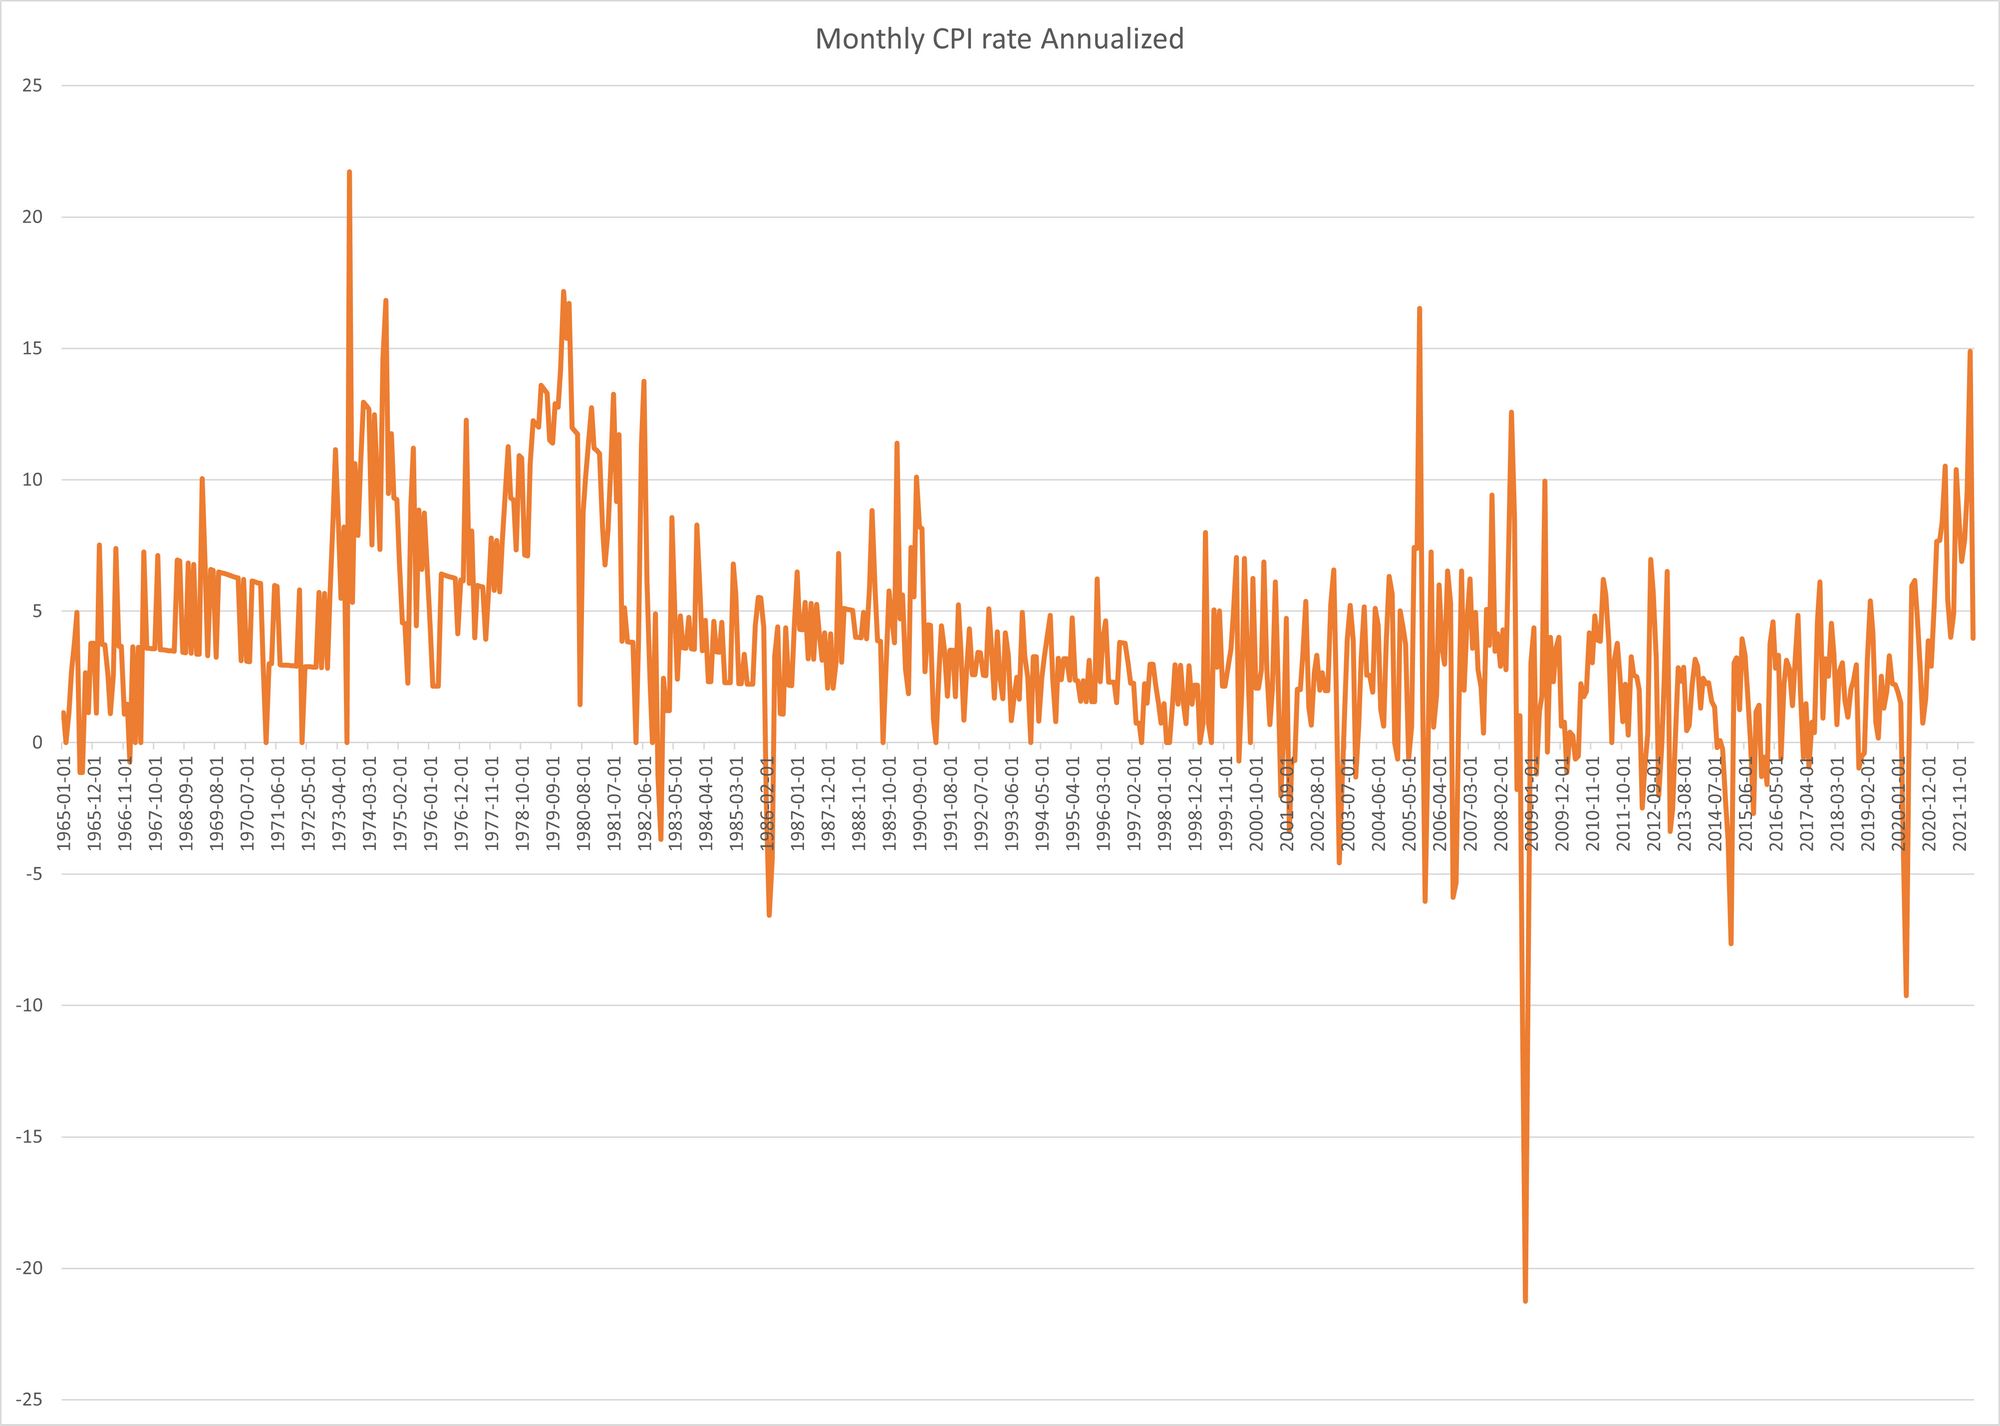
Again, zooming in to the years since the GFC...
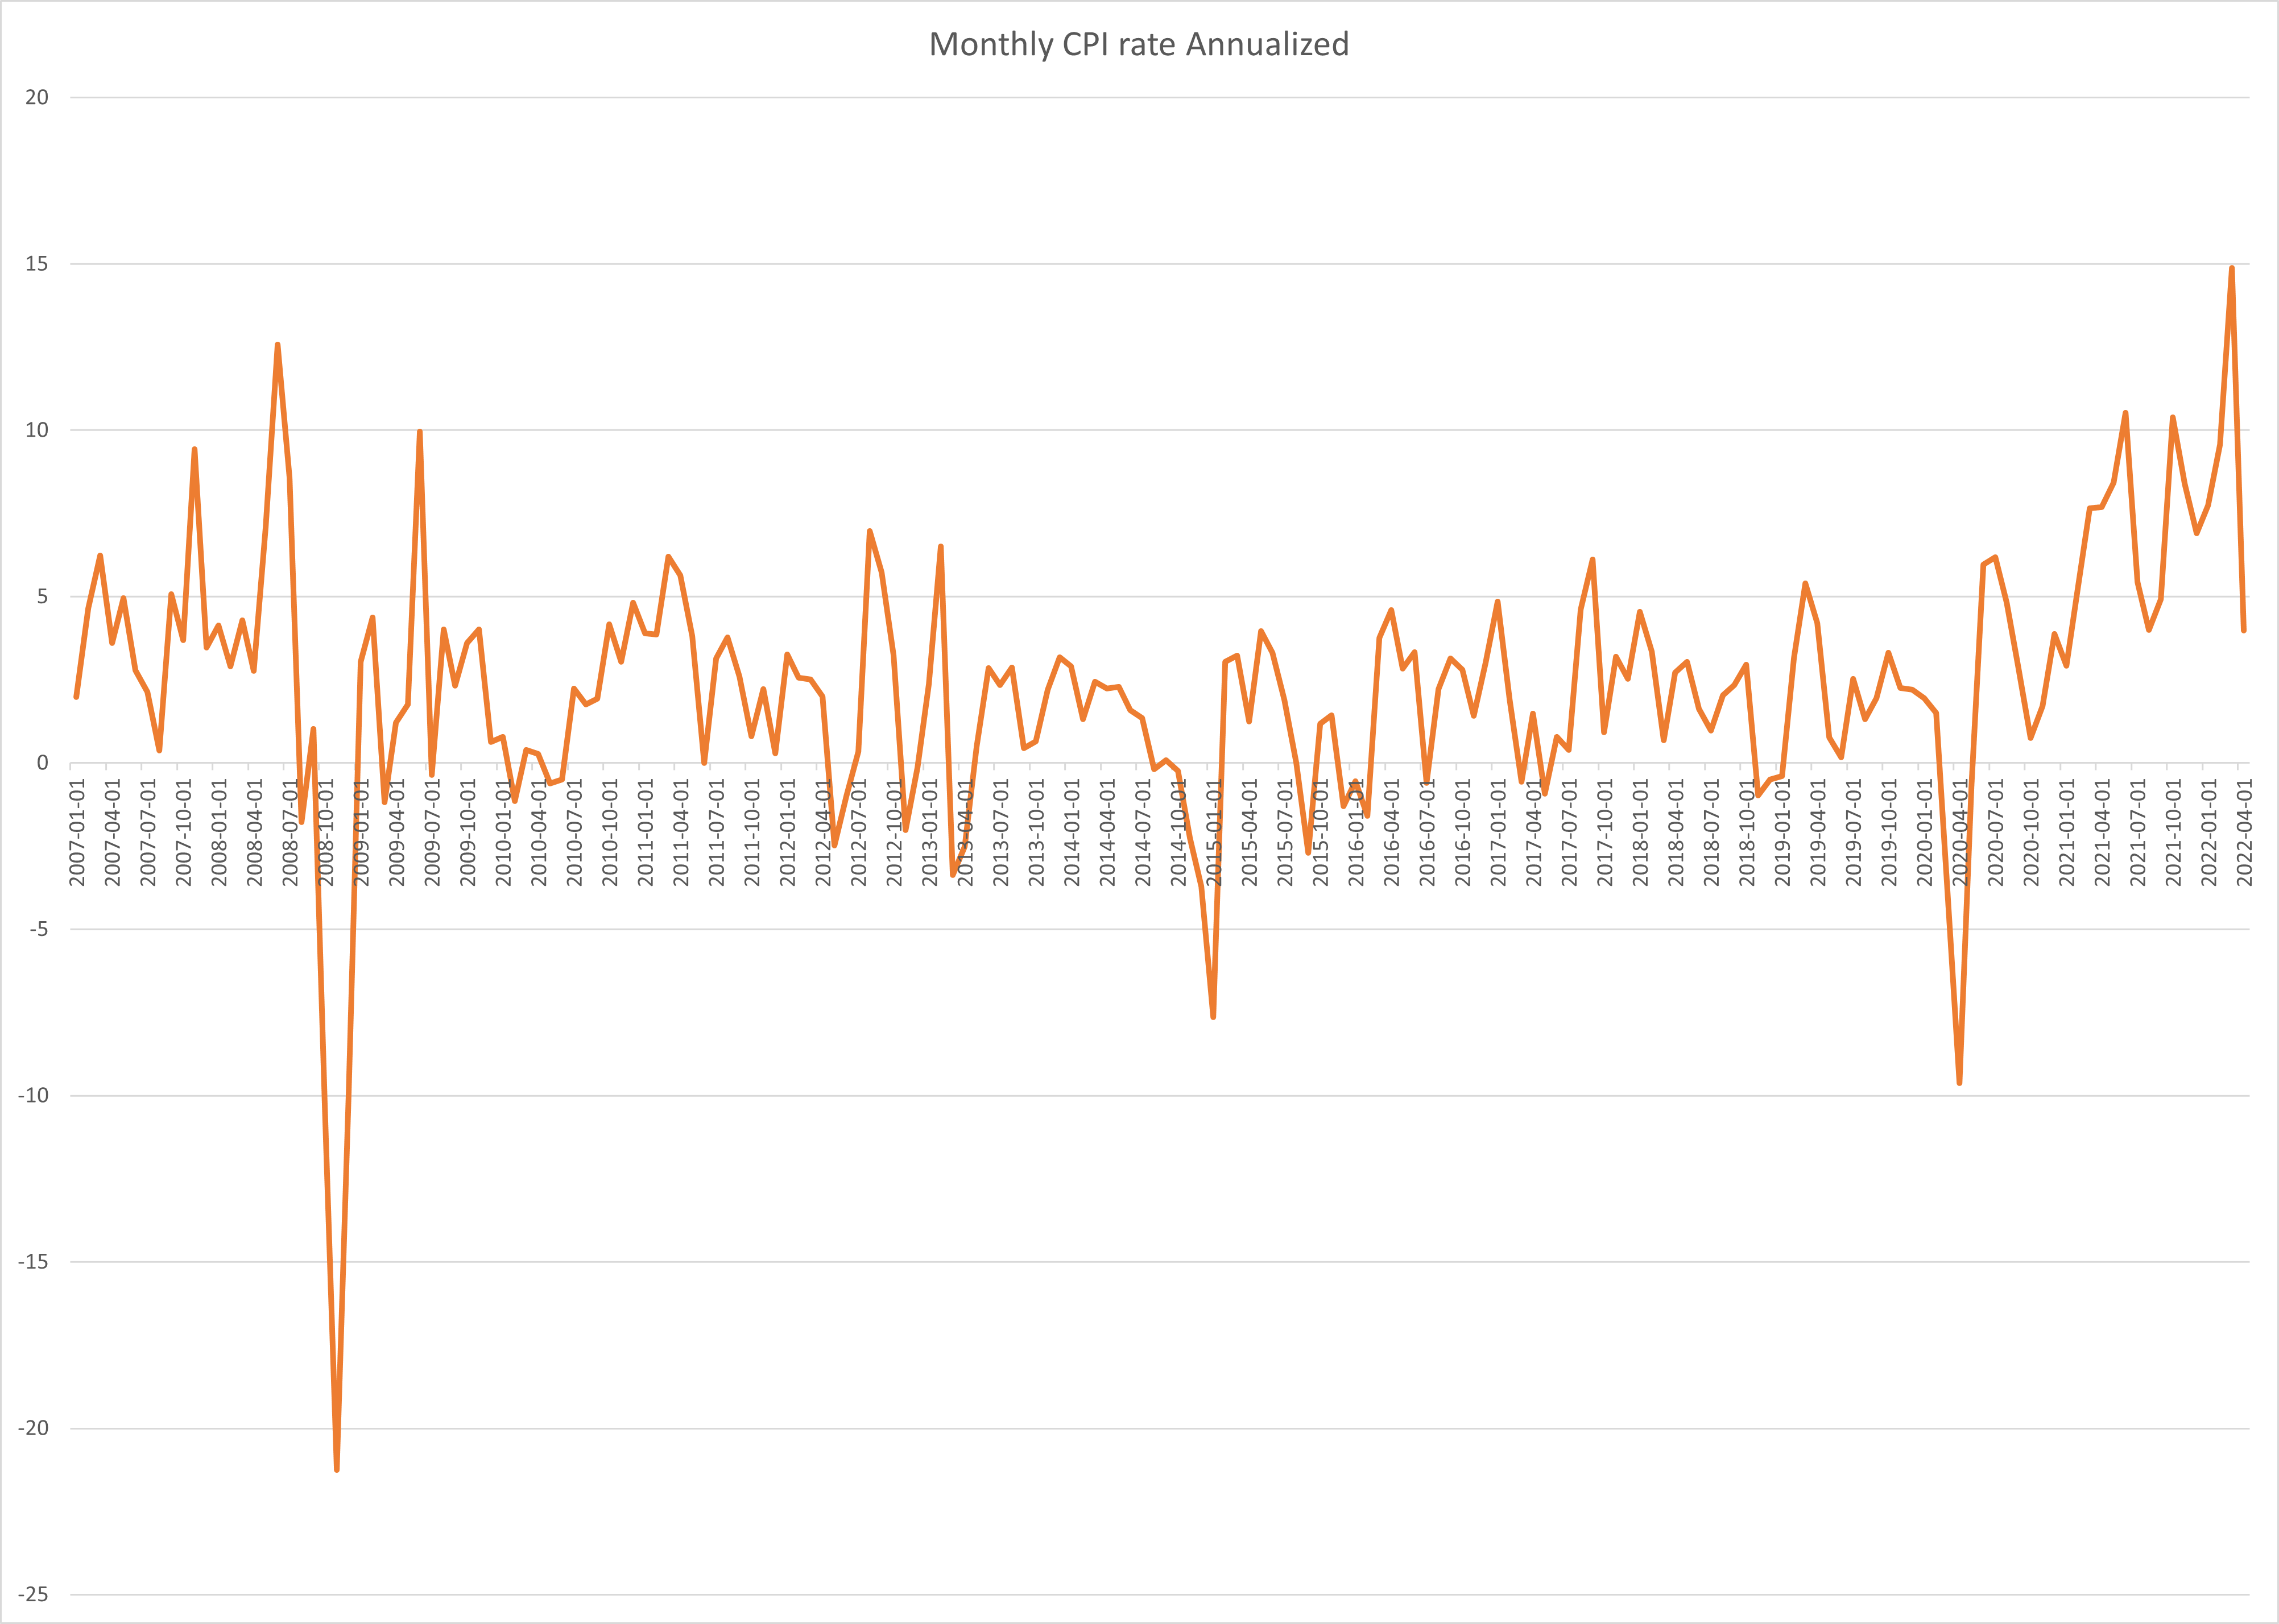
I want to point your attention to the most recent month's number. It is the lowest since January 2021, and obviously shows a break of the higher inflation levels of the last 12 months.
While in the long term chart, our recent readings have been historically high, this is yet another blow-off top, parabolic move. "The best cure for high prices is high prices."
If oil prices end the month below $110, we could see and even lower MoM CPI. That would majorly shift the inflation narrative IMO and lead to a risk on of sorts. Especially, if the Fed does a 50 bps hike and shifts to dovish rhetoric in the face of recession.
Conclusion
All these charts show massive parabolic moves, some to historically high levels that the market has never been able to support before, even in the very best of times. There is no way that a global economy in free fall and a US economy in recession will be able to hold these types of levels.
There will be demand destruction, CPI will come down, capital will flee to the dollar, dollar denominated assets like US stocks, bonds and real estate, as well as bitcoin.
Cheers,
A