Bitcoin Above 50 DMA, But Breakout Not Confirmed
Quick look into the current price levels for Bitcoin, as it breaks out of horizontal resistance.

Bitcoin & Markets | Mar 16, 2026
Welcome to my weekly “Quick Chart” posts. These public posts are meant to be short, a few quick charts with a brief explanation.
Make sure you're SUBSCRIBED!!
Today we’re looking at the Bitcoin Daily Chart.
First up is the volume-by-price profile. Unlike a normal volume chart that shows trading activity over time, this chart shows how much bitcoin has traded at each price level. That matters because traders tend to cluster their orders where a lot of activity has already occurred. These areas often become support or resistance zones.
You can see that bitcoin has built a significant amount of support below the current price. At the same time, price is now moving through a relatively low-volume section of the chart, where fewer trades have taken place historically. When price enters these thin areas, it can often move more quickly because there are fewer orders to absorb buying pressure.
The next major volume cluster sits around $87,700, which also happens to be near the yearly open. That level is likely to act as the next major test if the rally continues.
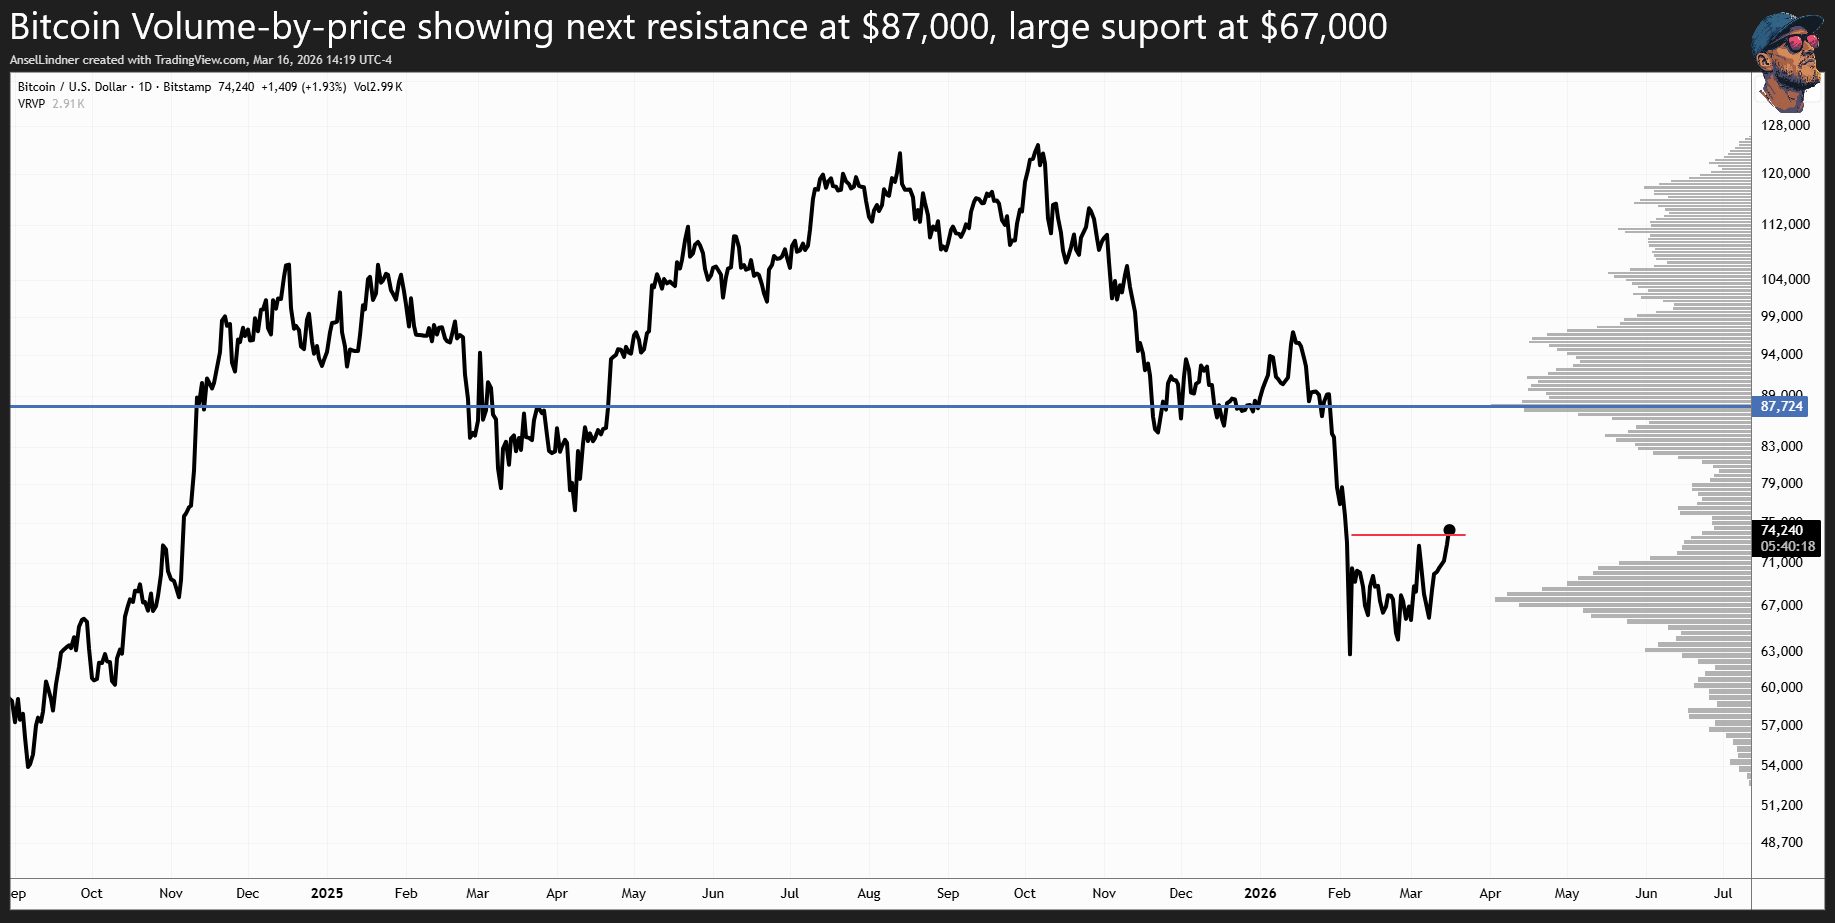
Before reaching that point, however, bitcoin still has to clear several smaller resistance levels. If price can push through those barriers this week, it would set the stage for a move toward the $87k region over the next couple of weeks.
Technically, bitcoin has now moved back above the 50-day moving average. That’s an encouraging development, but by itself it isn’t enough to declare a fully bullish breakout. We saw a similar situation back in January, when price stayed above the 50-day average for a short time and even broke some horizontal resistance, but ultimately failed to sustain momentum. So that possibility still exists.
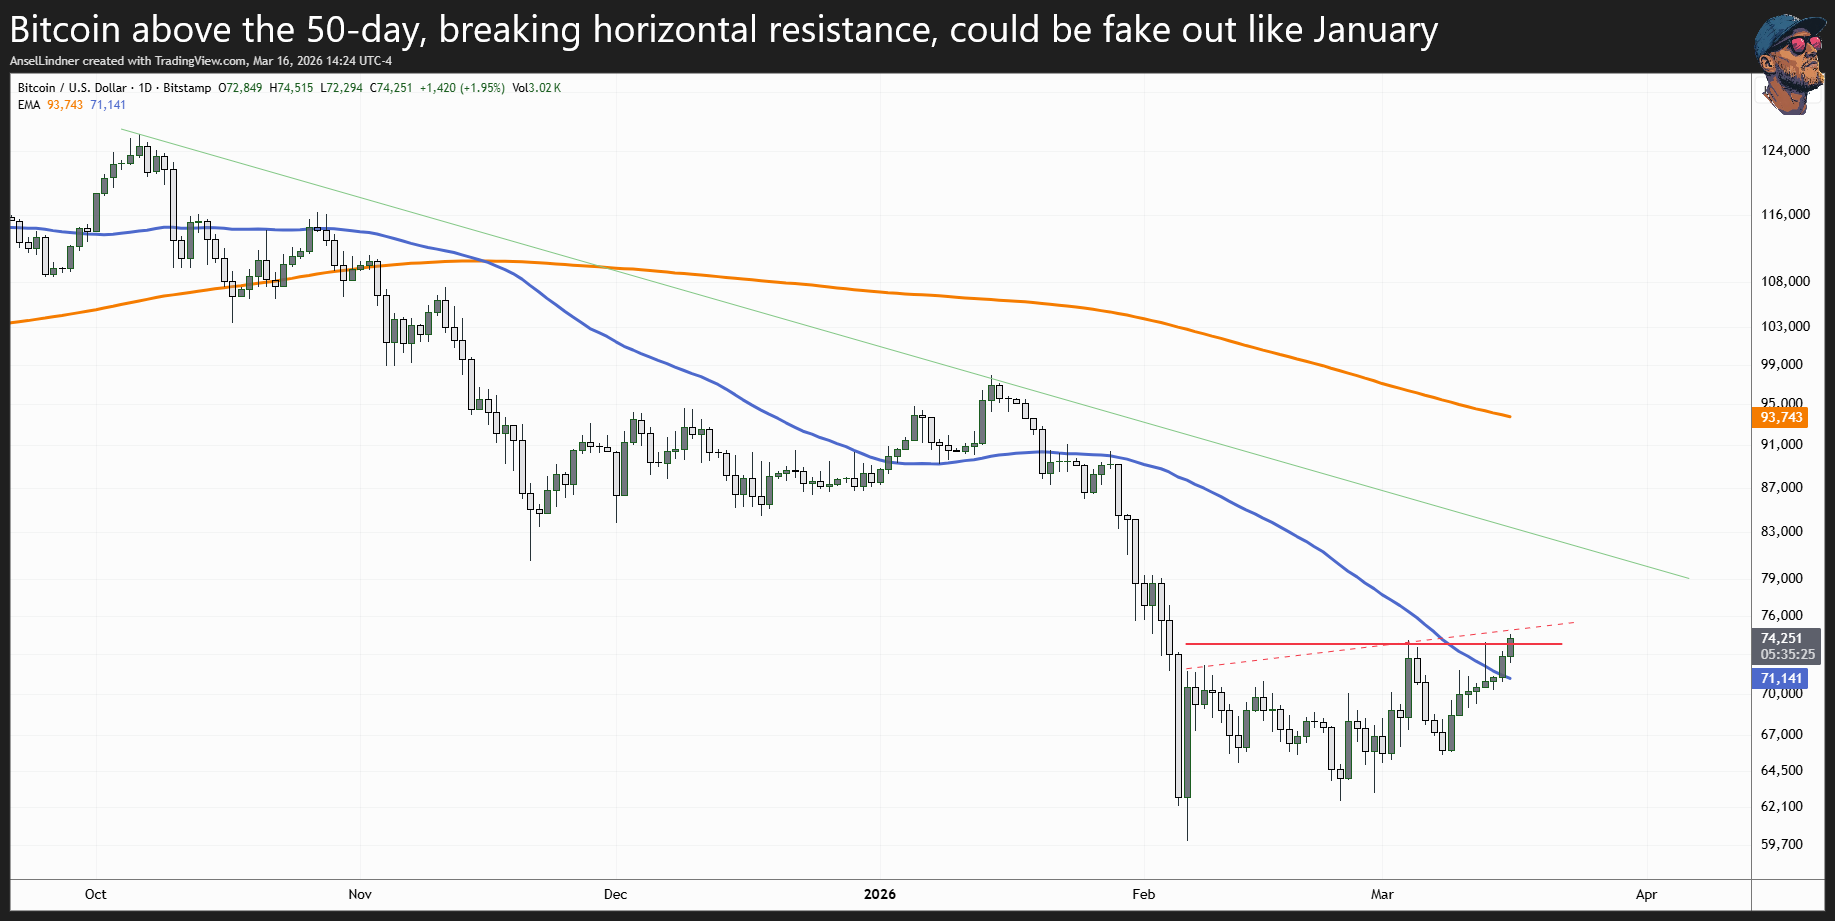
That said, the current move appears more structurally sound. Support has been building below price, and the market is now pushing into a thinner part of the volume profile where advances can happen more quickly.
The next major milestone will be a close above ~$77,000 to clear the horizontal resistance. The diagonal trend line from the ATH (light green) can be crossed at ~$81k. After that, we reach $87k.
Buyers must maintain momentum right now. The breakout is in a precarious spot, and if it fails with price slipping back down to $70k, we could revisit the lows. Price must continue higher, or the breakout is lost.
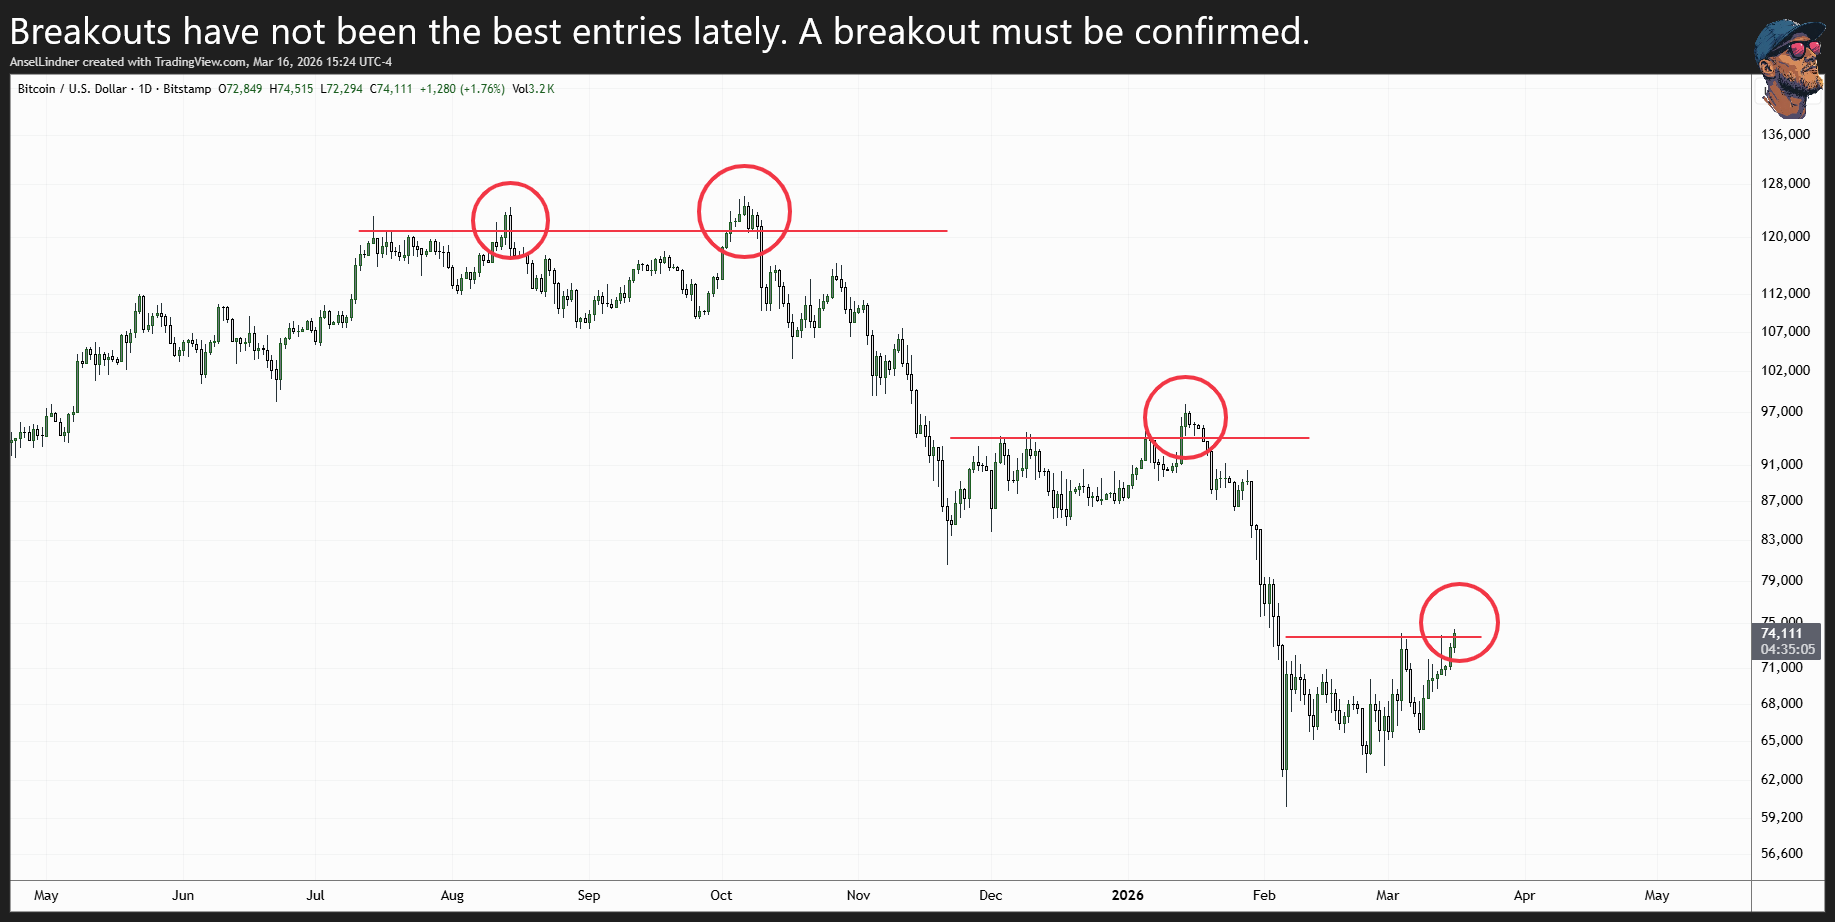
In recent history, simply buying a breakout hasn't worked very well. We need additional confirmation. Those near-term hurdles I pointed are the levels to watch. I'll turn full bullish above $77,000.
All that said, the chart is improving, but caution is still warranted. Margin use should be minimal at this time, with a tight stop-loss, if you are leveraged trading.
HODL strong. Thanks for reading! PLEASE SHARE!
A
- Podcast links and Socials
- Disclaimer
- Feedback form
- Original charts and analysis are CC-BY