Liquidity, Business Cycles, and Deglobalization
Explaining the Weird Market: From Slow-Motion Business Cycles to Shifting Liquidity and the End of Global Synchronization

Rogue Report #110 | October 29, 2025 | Block 921,373
Dear reader,
Let's talk about the new cycle theories abounding right now. I've touched on the PMI theory and the Russell 2000 correlation, but another new one just hit yesterday, the copper-to-gold ratio (Cu/Au ratio). I have touched on the bearish signals from the Cu/Au ratio in recent content, but not in the context of bitcoin cycles. There are a few mismatches that we need to sort out.
Liquidity
The idea that bitcoin cycles are driven by global liquidity was the first major alternative to the simple “halving cycle” narrative. A couple of years ago, analysts began arguing that bitcoin’s rhythm mirrored broader macro liquidity cycles.
But “liquidity” was never clearly defined. Some people used Global M2 as a proxy, others combined central bank reserves, policy stance, M2 among other things into composite metrics. While those measures capture important aspects of liquidity, I don’t think they explain bitcoin or gold’s performance particularly well.
There is another form of liquidity that is more important, financial system liquidity. We can think of this like viscosity. It's not about the quantity of money, it’s about how readily credit is created in the financial system and how easily money moves between banks and in credit channels. Measures of "liquidity" without thought to viscosity will find it hard to reliably measure liquidity.
Viscosity, or deep system liquidity, circumscribes the abstracted form of liquidity the others were measuring. If M2 is rising, but viscosity is also rising (flow getting worse), overall liquidity is falling.
PMI
The Purchasing Manager's Index (PMI) is one of the best real-time indicators of economic activity. It surveys purchasing managers each month about new orders, production, employment, and inventories. A reading above 50 signals expansion; below 50, contraction.
Recently, several analysts on X (including Enea Denkt, whom I interviewed) highlighted a strong correlation between PMI and bitcoin price cycles. The relationship checks out: bitcoin thrives in expansions and retreats in contractions.
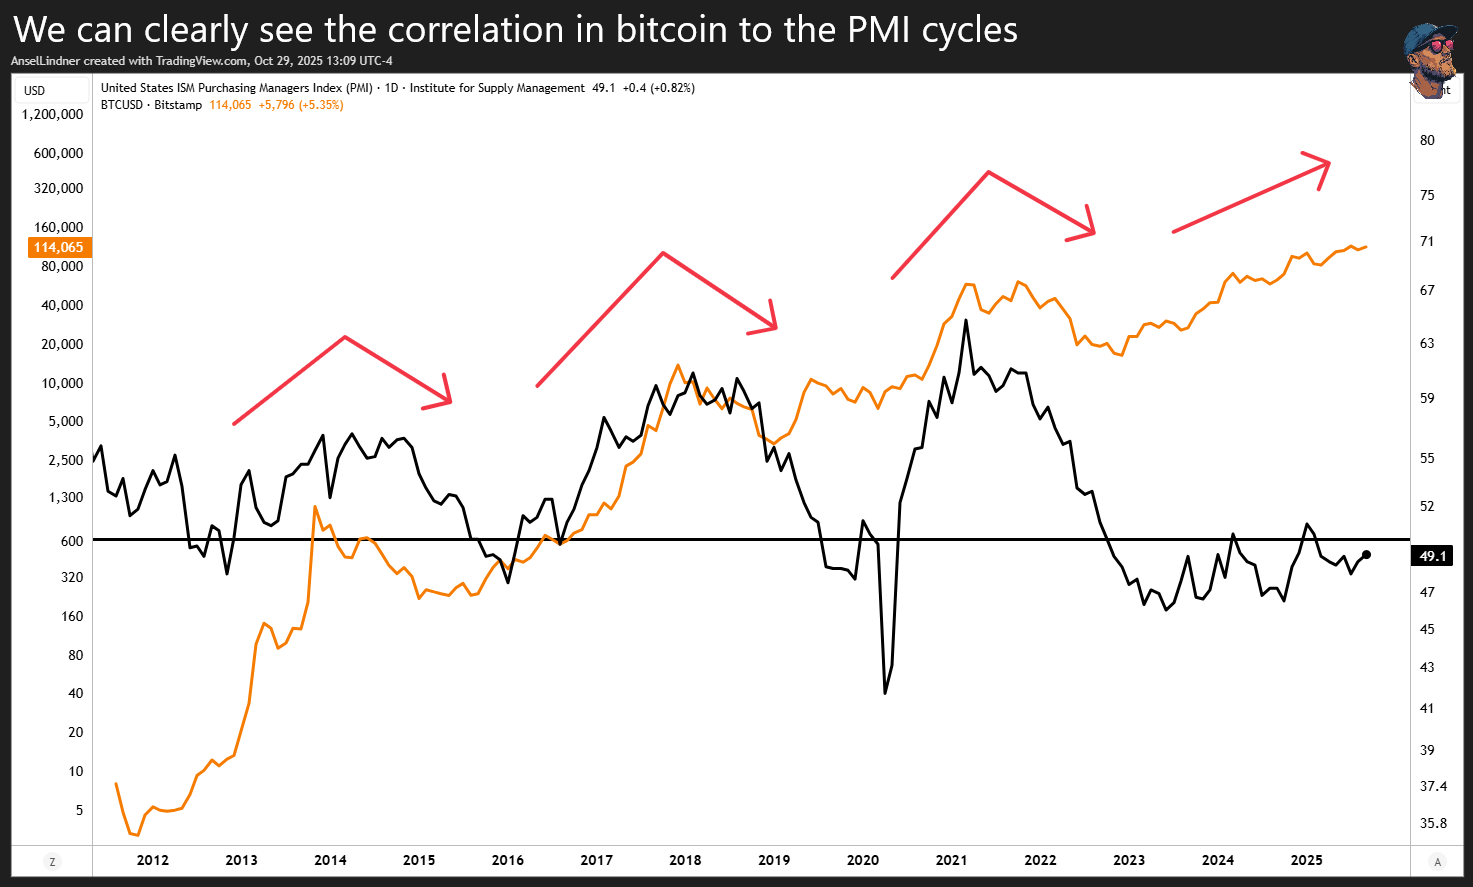
The data supports this—over the last decade, the median correlation coefficient between PMI and bitcoin is +0.54, meaning the two move in the same direction most of the time. Bitcoin behaves as a high-beta expression of the business cycle, sensitive to liquidity and sentiment just like small-cap equities.
Recently, we've seen a tough 33 out of 35 months below 50, in contraction for the PMI. But there is a noticeable positive trend and PMI looks to be imminently headed higher. Despite this poor performance in the PMI, bitcoin has continued higher, but in a subdued fashion. This has led me and others to say that the bull market hasn't really started. PMI is implying an imminent return to expansion.
Russel 2000
This brings us to another surprising correlation. The Russell 2000, a small-cap index that lives and dies by liquidity, credit conditions, and growth expectations, has been tracking bitcoin with uncanny precision.
In fact, past cycle breakouts in the Russell 2000 have aligned with bitcoin’s own breakouts to the month: 2016, 2017, and now again in late 2024. That’s remarkable symmetry for two seemingly unrelated assets. And the Russell is breaking out right now, again.
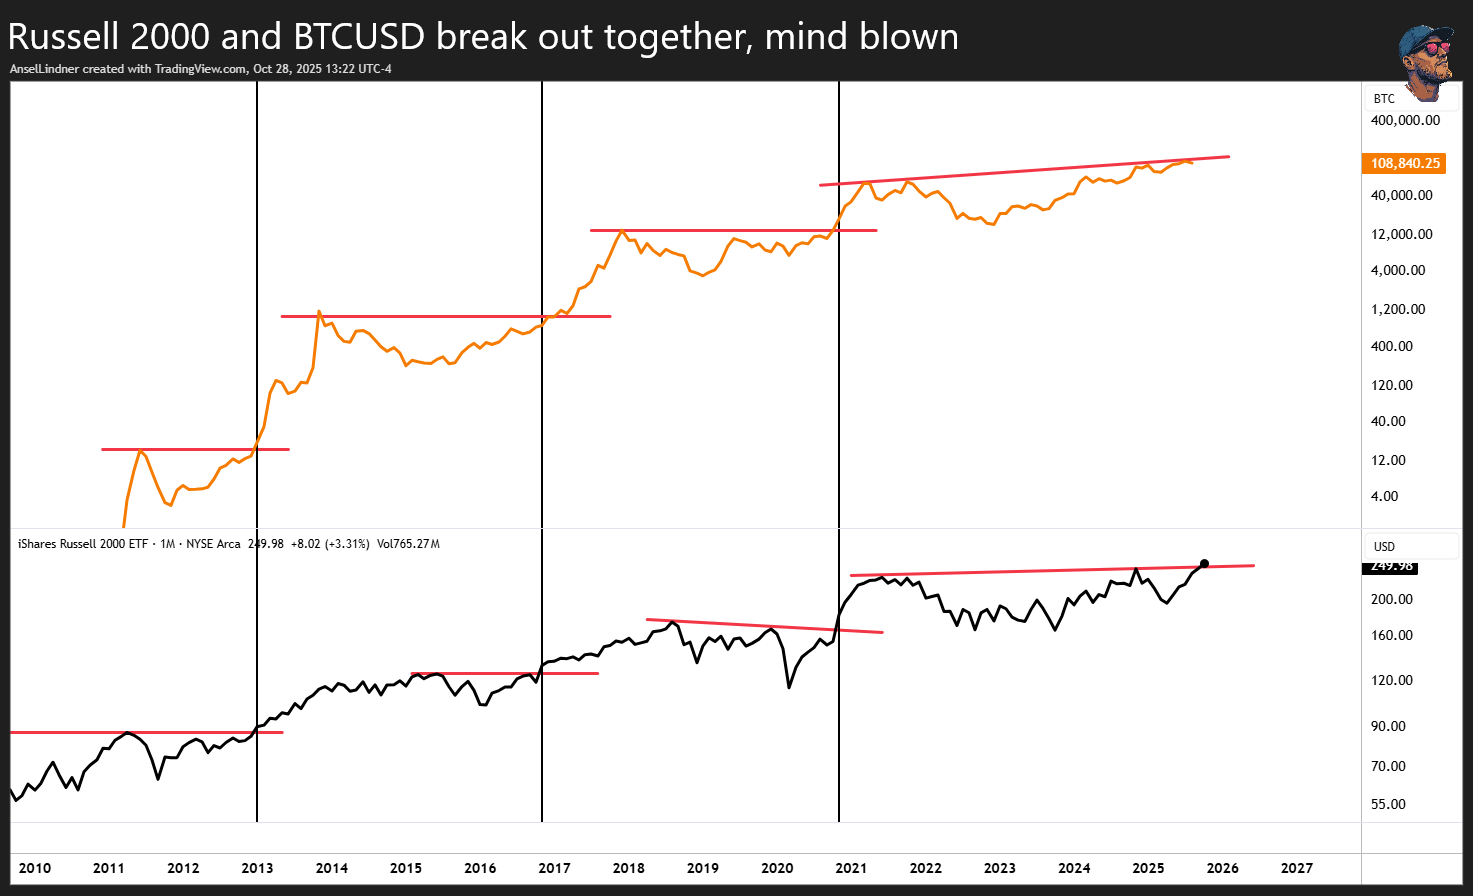
PMI and the Russell together paint a bullish macro picture. They’re both signaling improving conditions; a turn in liquidity, easing credit, and renewed growth expectations. But then we hit a snag when we look at our next indicator.
Copper to Gold Ratio (Cu/Au)
The copper-to-gold ratio has long been a classic macro barometer. Copper rises with industrial demand and growth optimism; gold rises with fear and uncertainty. A rising Cu/Au ratio implies expansion and risk-on sentiment, while a falling ratio signals tightening and risk aversion.
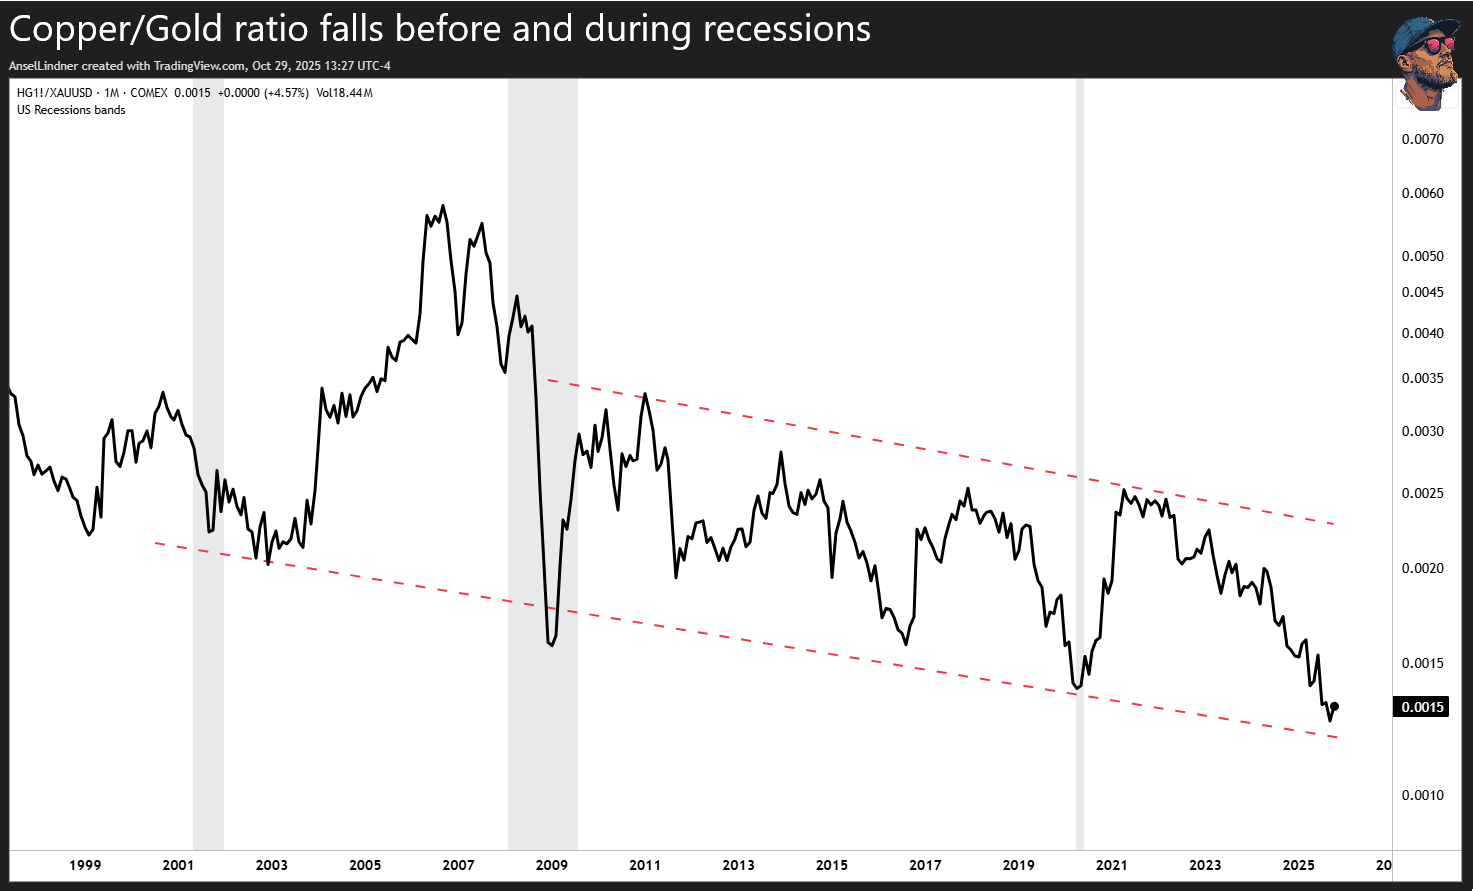
Right now, that ratio is sitting at record lows—the lowest in the series available on TradingView—after a long, grinding decline. Under normal conditions, that would scream “imminent recession.” It’s hard to imagine Cu/Au collapsing this far without the economy being in dire straits.
But the situation is complicated. Gold’s recent move has been historic. If gold now starts to weaken, copper doesn’t have to rally for the ratio to turn around; copper could also fall, just less than the hyper-extended gold price does.
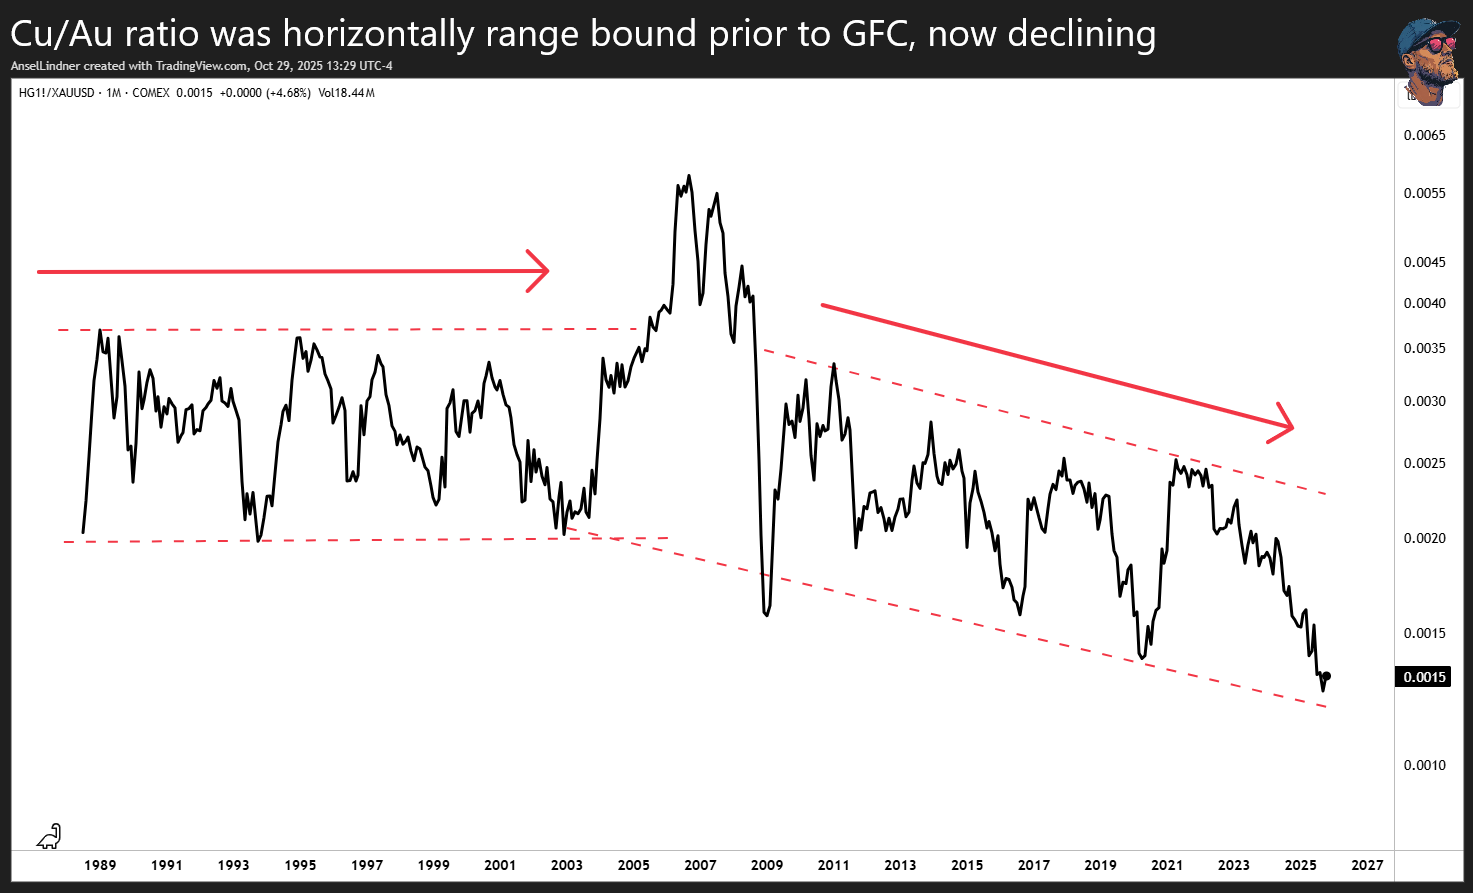
Something else stood out when looking at this chart. If we zoom out for the whole series, we can see a clear change in behavior around the Great Financial Crisis. Prior to the GFC, the Cu/Au ratio traded in a horizontal channel. After the GFC, it shifted into a descending channel. That means gold has systematically outperformed copper ever since, which aligns with my broader macro thesis that we’re approaching a major change in the global financial system, one trending back toward sound money.
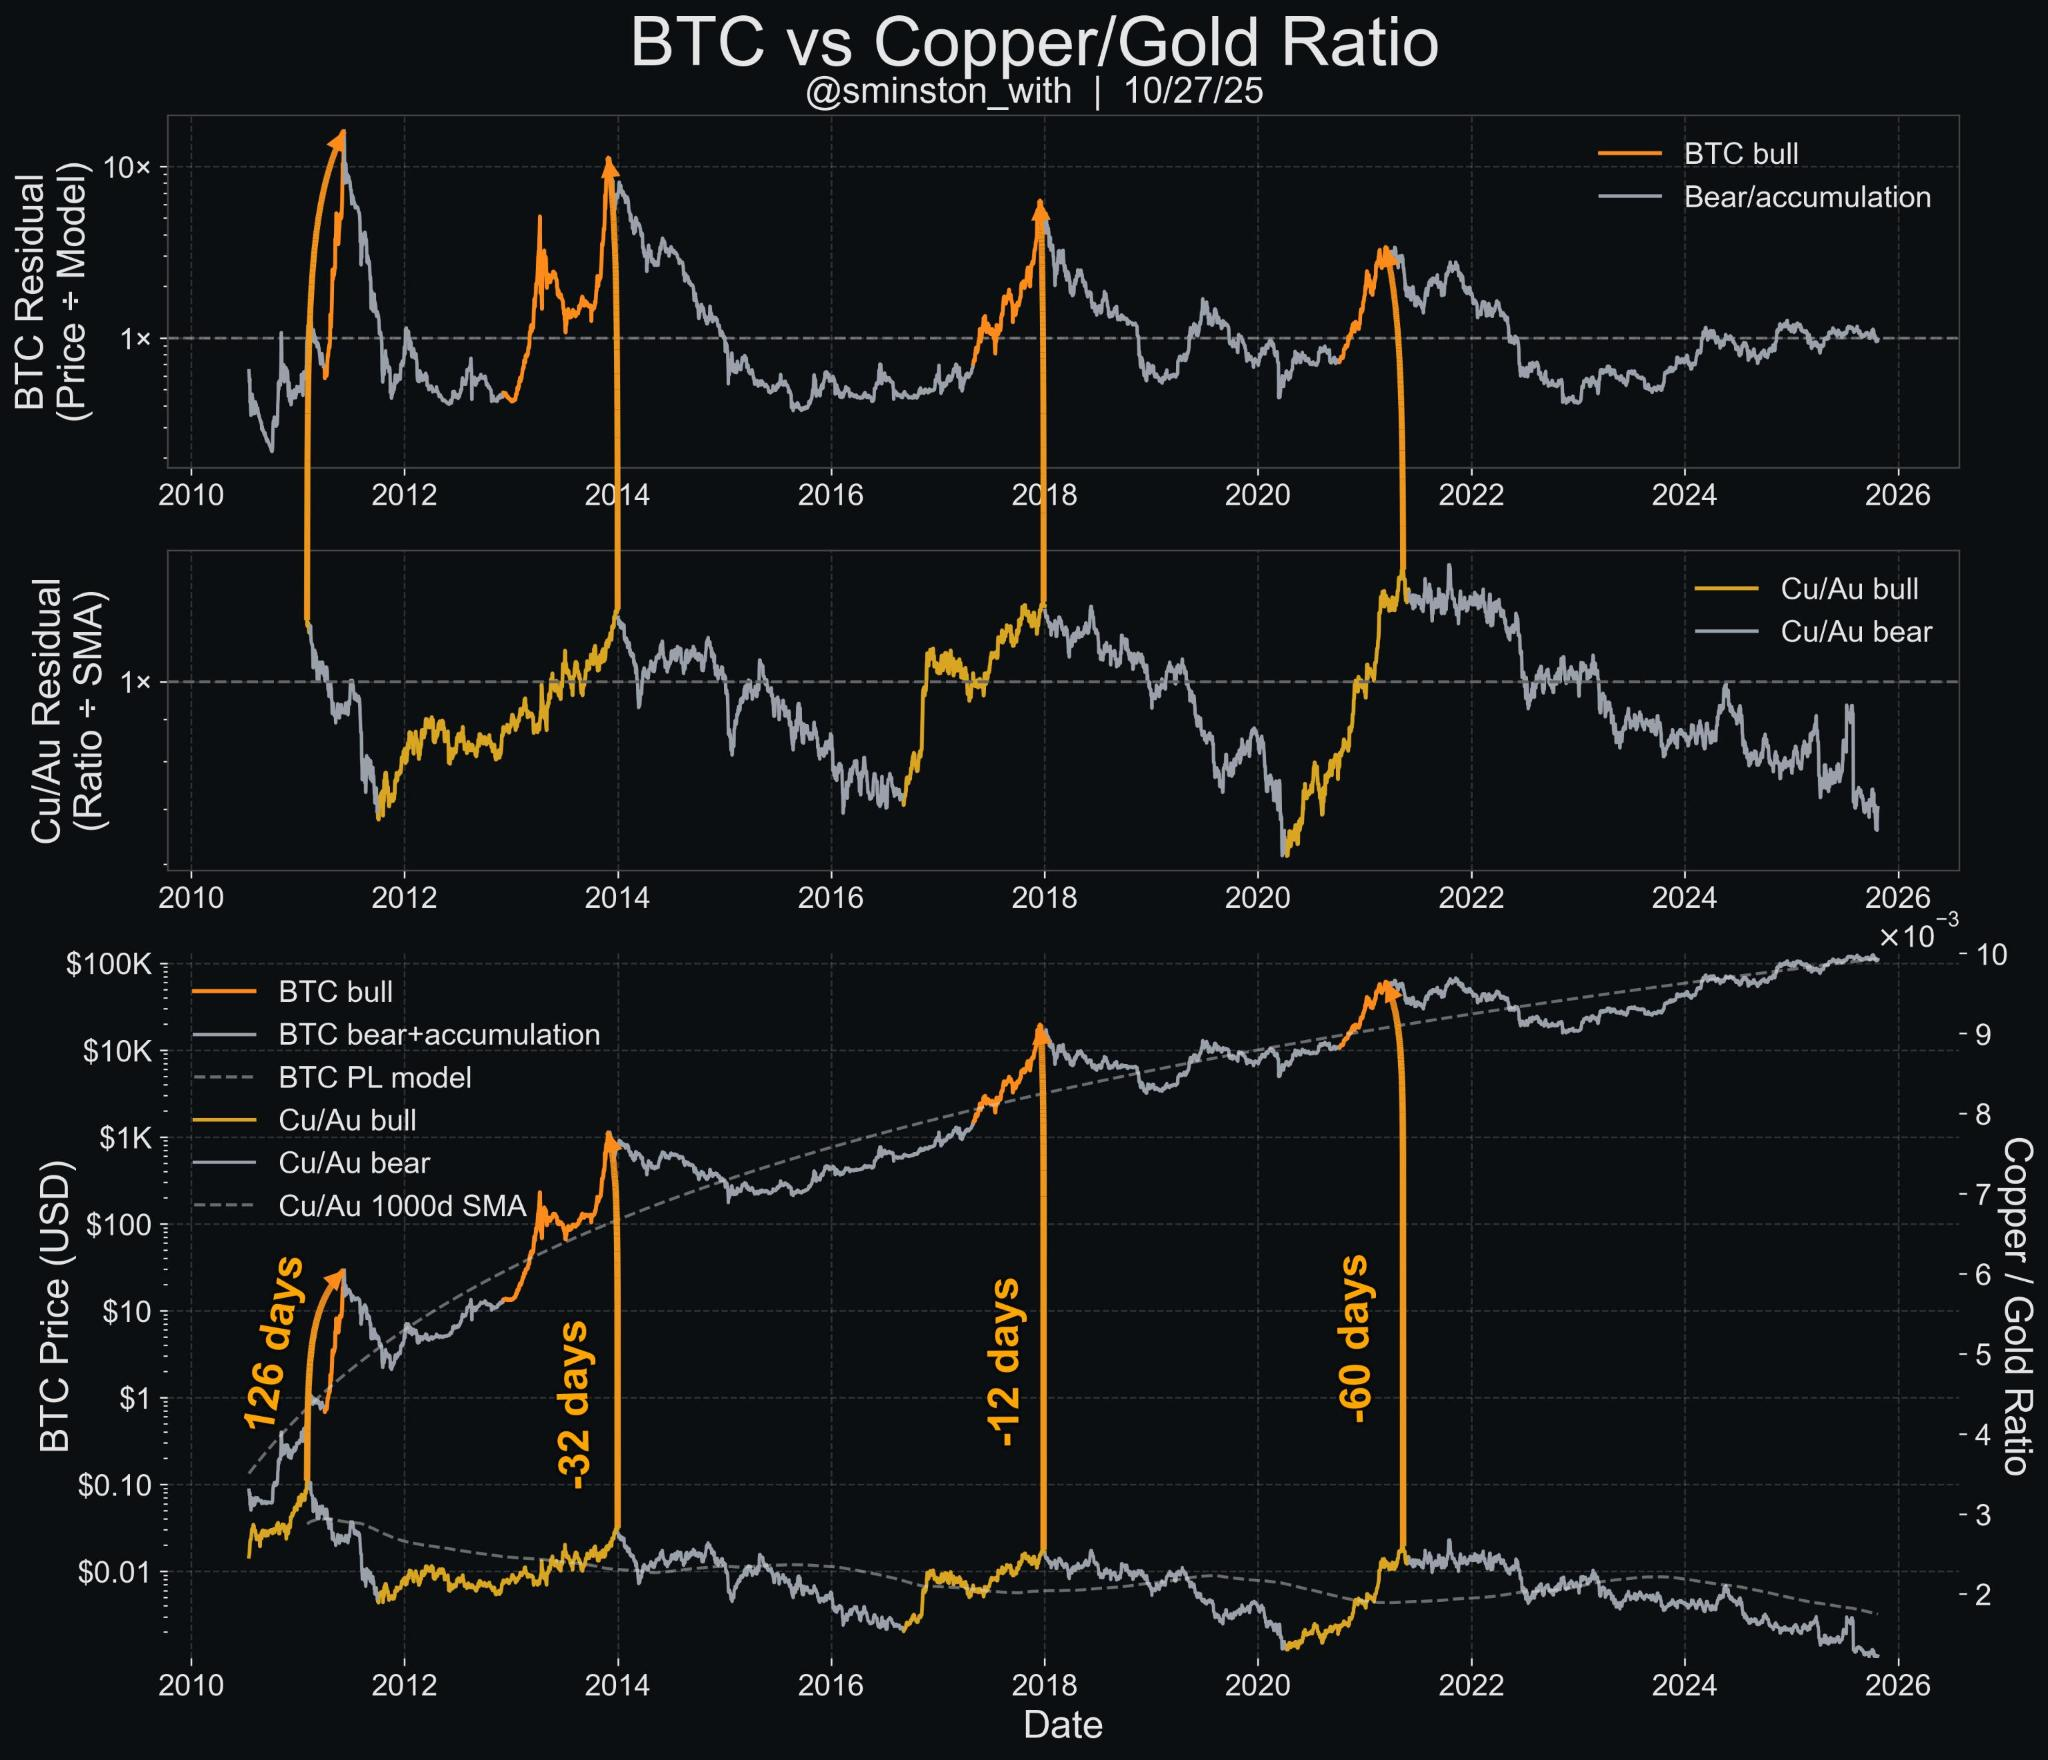
Yesterday, this chart from @Sminston_with went a little viral in bitcoin circles, showing that bitcoin peaks align closely with Cu/Au peaks. However, it doesn’t line up during the first half of bitcoin’s bull markets. Bitcoin typically bottoms long before Cu/Au does, and only hits its final parabolic leg when copper starts to outperform. Therefore, this indicator isn’t very useful for spotting a bottom in bitcoin, only a top.
We also run into another problem. A falling Cu/Au ratio like this heavily favors recession, not an imminent bull market like the PMI and Russell 2000 are signaling. They are in disagreement. So what could that mean?
Conclusion
A member of my Telegram community, LarryJr, connected the dots. He pointed out that Cu/Au is a global market, while PMI and the Russell 2000 are U.S.-only indicators. That could be why they’re disagreeing. The U.S. might be bound for a bull market, while the global economy, dominated by China, is in a deep industrial recession.
That’s a fantastic insight, because it fits perfectly with what I’ve been arguing for years: China is in recession, and the Cu/Au ratio confirms it. What I’ve been calling a “weird market” isn’t so weird after all. It’s simply the visible result of deglobalization playing out in real time.
Where does that put bitcoin and gold? Gold, being the more global asset, will likely stay aligned with the Cu/Au ratio—a barometer of global recessionary pressures and flight to safety. Bitcoin, by contrast, is now U.S.-dominated, increasingly shaped by domestic liquidity, credit, and investor flows. That means its correlations with the PMI and Russell 2000 should remain stronger, following those liquidity markers higher.
In short: a domestic U.S. boom alongside a foreign bust would benefit both assets; gold as a global hedge, bitcoin as the speculative expression of U.S. liquidity.
Looking ahead, this framework also fits bitcoin’s familiar stair-step model. As U.S. liquidity improves, bitcoin climbs each step. But if the U.S. buildout is strong enough to lift copper and the Cu/Au ratio, that could mark the first signs of an exponential leg higher in bitcoin.
HODL strong. Thanks for being members!
A
- Podcast links and Socials
- Disclaimer
- Feedback form
- Original charts and analysis are CC-BY
* Since last Rogue post