Alarming China Financial Crisis | Credit-based Money Trap and Bitcoin - FED 104
Updating the situation in China's real estate and banking sectors, Bitcoin price analysis, and the Euro vs Bitcoin.
Hosts: Ansel Lindner and Christian Keroles
Listen To This Episode: Apple / Spotify / Google / Libsyn / Overcast / RSS
Fed Watch is a macro podcast with a true rebellious bitcoin nature. Each episode we question mainstream and bitcoin narratives by examining current events in macro from across the globe, with an emphasis on central banks and currencies.
In this episode, CK and I catch up on the week, go through an update on the evolving Chinese financial crisis, talk about why “fiat” money today should rightly be called credit-based money and the side effects of that fact, and lastly, we dive into the bitcoin chart and so forth.
You can access this episode’s slide deck of charts here or below, depending on the medium where you are viewing these show notes.
Please check out the Fed Watch Clips channel on YouTube, subscribe and share.
China
First up, is the situation in the Chinese economy. They are facing some major issues in their real estate market, economy and banking system. Currently, 28 of the top 100 real estate developers have defaulted on or restructured their debts. There is a growing “mortgage boycott”, where purchasers of unbuilt housing units in projects that are now delayed due to the pandemic, developer financial situation, and zero Covid policy, have refused to pay their mortgages. It started with 20 projects and has since grown to 230 projects.
The boycott accounts for roughly 100,000 households refusing to pay their mortgages. This amounts to 0.1-0.5% of all outstanding mortgages and 1% of outstanding mortgage value.
The rhetoric around this mortgage crisis is eerily similar to that in the US in 2007. Excuses like it is a small number of mortgages, effects are contained, and others are being used.
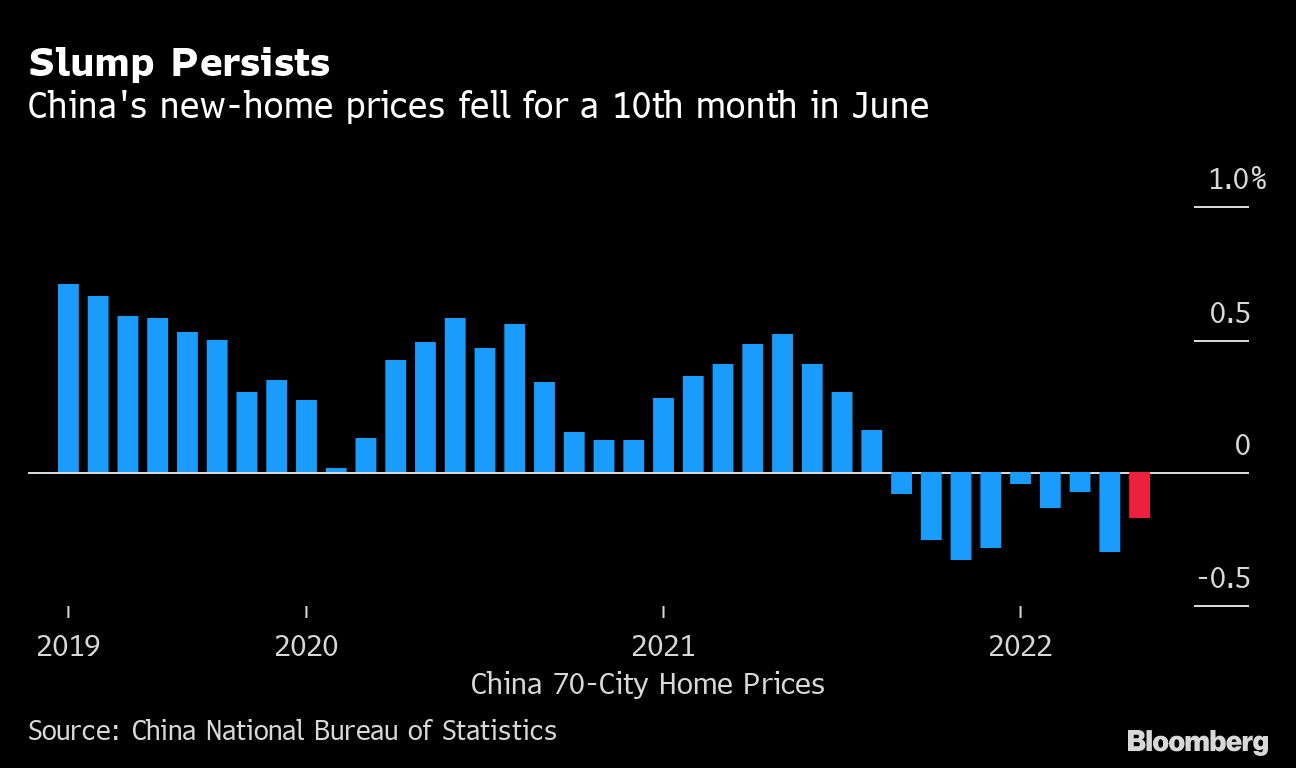
As a result of the developer and mortgage problems, small and medium sized banks are running into solvency issues. Chinese banks have $9 trillion in exposure to real estate and it accounts for 20% of bank assets. You can see if there were a problem with perpetually falling home prices, it could very quickly cause a solvency issue for banks as well. Indeed, that is exactly what we are seeing.
New unit home prices in China have fallen for the 10th straight month in June.

Source Bloomberg
GDP crashed in Q2 2022 to 0.4%.
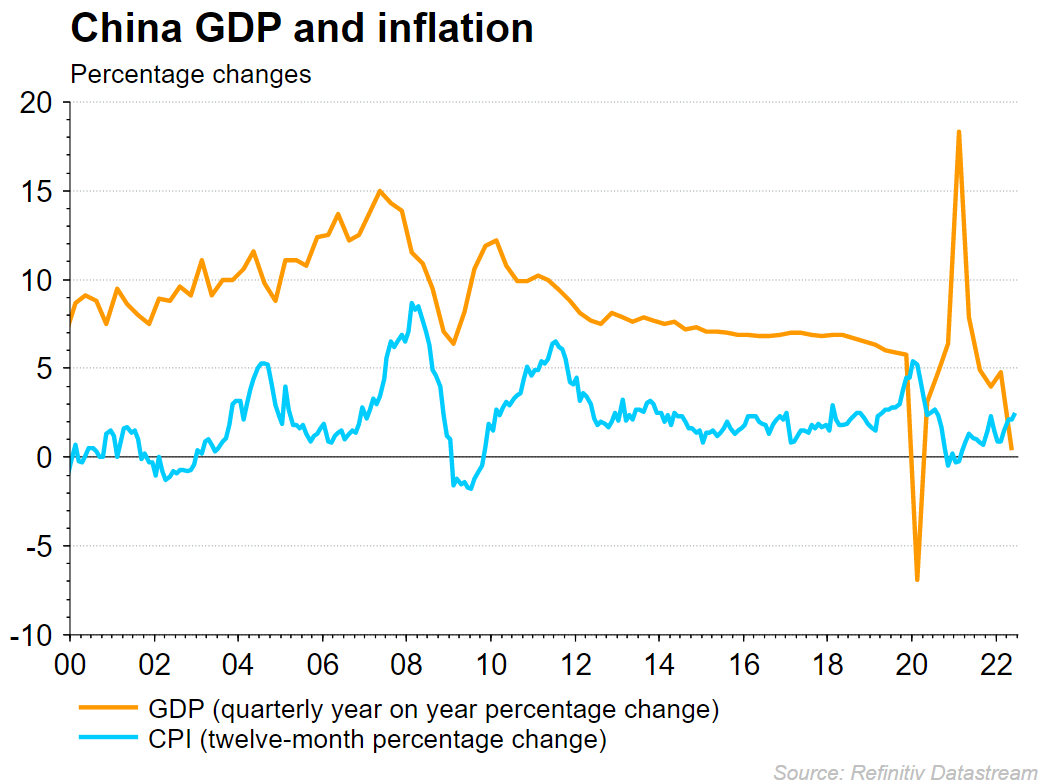
Source Refinitiv Datastream
The GDP chart nicely supports my personal macro predictions, that the major economies are going to return to the post-Great Financial Crisis (GFC) normal. Since the GFC, growth in China has been slowly trending downward. Then there was the violent economic disruption and whiplash effect in the economy, followed by a return to slowing growth.
At the end of the China segment of the podcast, I read through a fascinating article from Nikkei Asia on the situation around recent bank runs in Henan province, which you might have seen on social media. The article highlighted the abusive response to the bank run and the growing dangers of a full-blown financial crisis in China.
Bitcoin charts
Next we go through a couple charts on bitcoin. The first two charts highlight the similarities and differences in the chart during periods that resembled today’s price action. I pointed out that the current flat consolidation differs because it has higher highs and higher lows, where the previous breakout attempts did not.
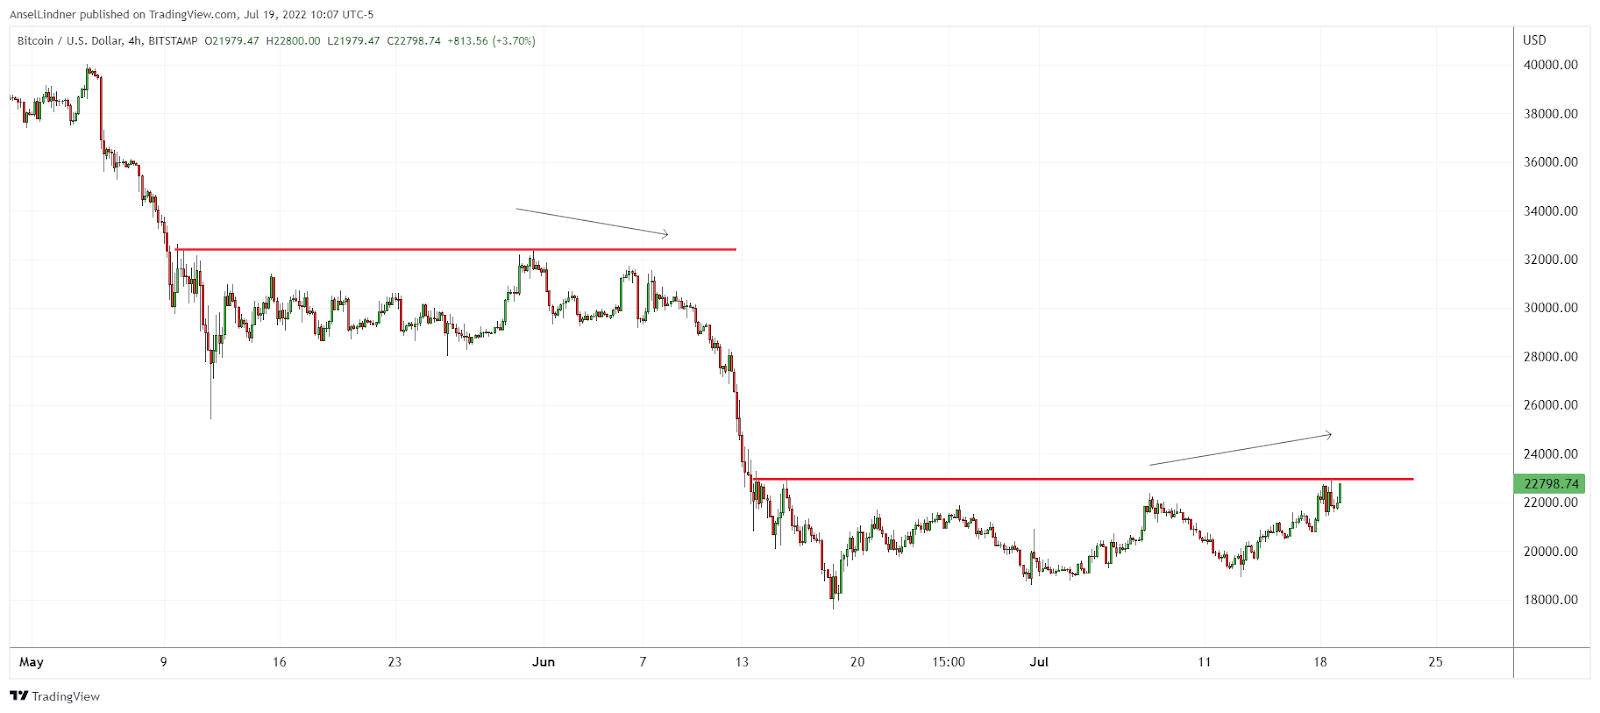
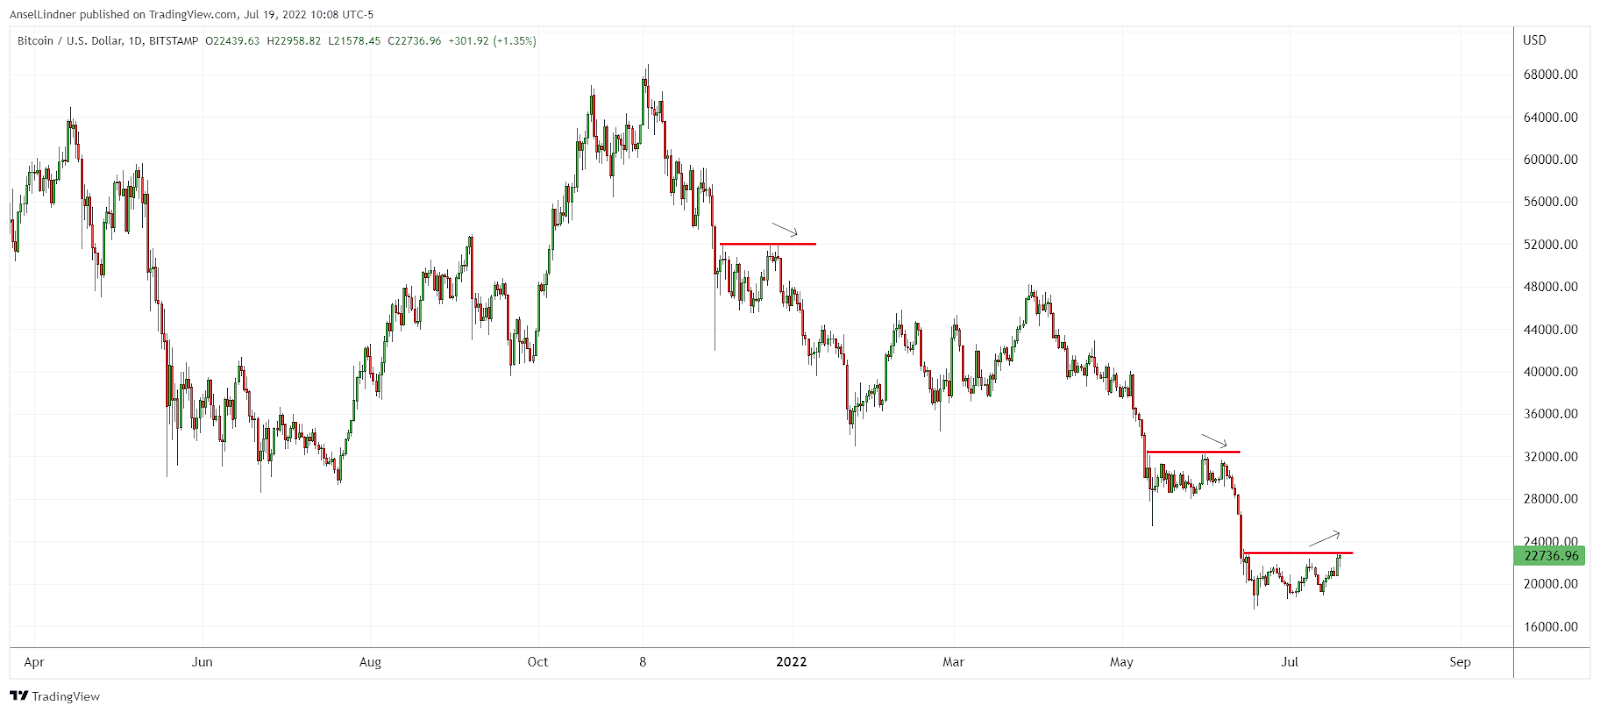
Source BitcoinAndMarkets.com
There are also some very interesting observations from Twitter on cash positions in hedge funds and the Bitcoin market.
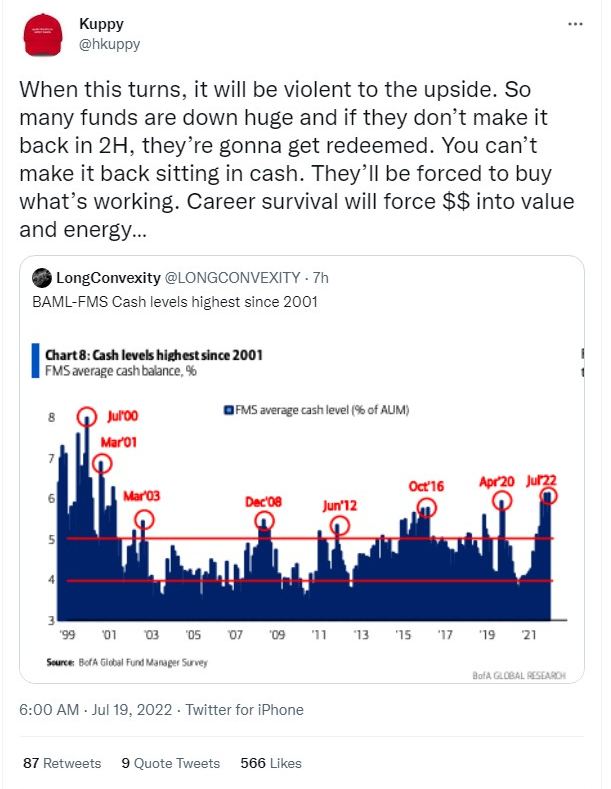
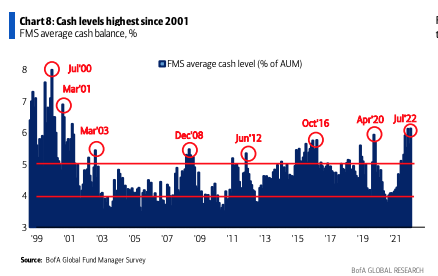
Top: Source @hkuppy; Bottom: Source @longconvexity
Kuppy is pointing out that the percentage of hedge fund portfolios that are cash is higher than any period since the Dotcom bubble back in 2001. When these peaks happen, and hedge funds rotate back into stocks, the market bottoms and puts in a nice rally.
We can also see this effect in the Bitcoin market.
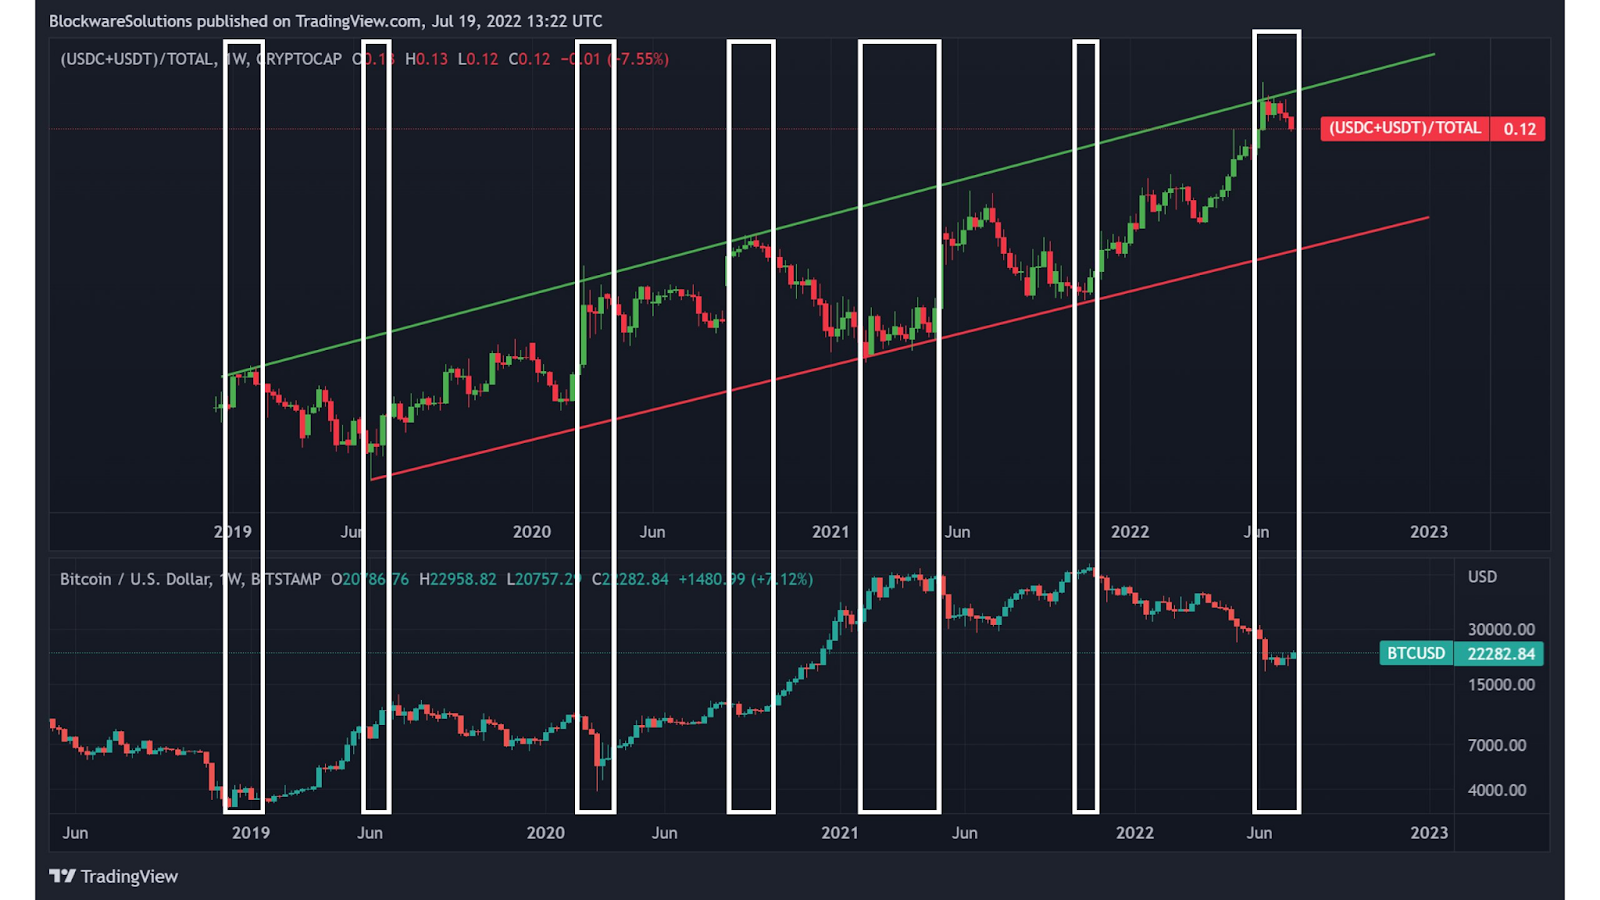
Source @WClementeIII
This chart is a little busy, but on top is the “stablecoin dominance” as I’ve called it, the ratio between stablecoin market cap and bitcoin’s market cap. It is a proxy for a “cash position” in the Bitcoin market. The bottom panel is the bitcoin price. What you see is at relative tops in the stablecoin ratio you see bottoms in price, because those stablecoins can rotate into buying bitcoin, and vice versa.
Dollar
There has been a massive amount of talk about the strengthening dollar. We are the only bitcoin podcast that unequivocally called for a strong dollar over the last 2 years, and boy have we been right on that.
I do not expect the dollar to sell off dramatically after its parabolic rise, but to establish a new higher range, perhaps between 100 to 115 on the DXY.
I stress that bitcoin does not need a weakening dollar to explode higher. In fact, if you look at the history of bitcoin charted with the DXY, you can see after periods of a rising dollar where bitcoin does sell off, the dollar establishes a new higher range, at which time bitcoin takes off. I didn’t have a chart prepared for this next statement during the live stream, but I include it below.
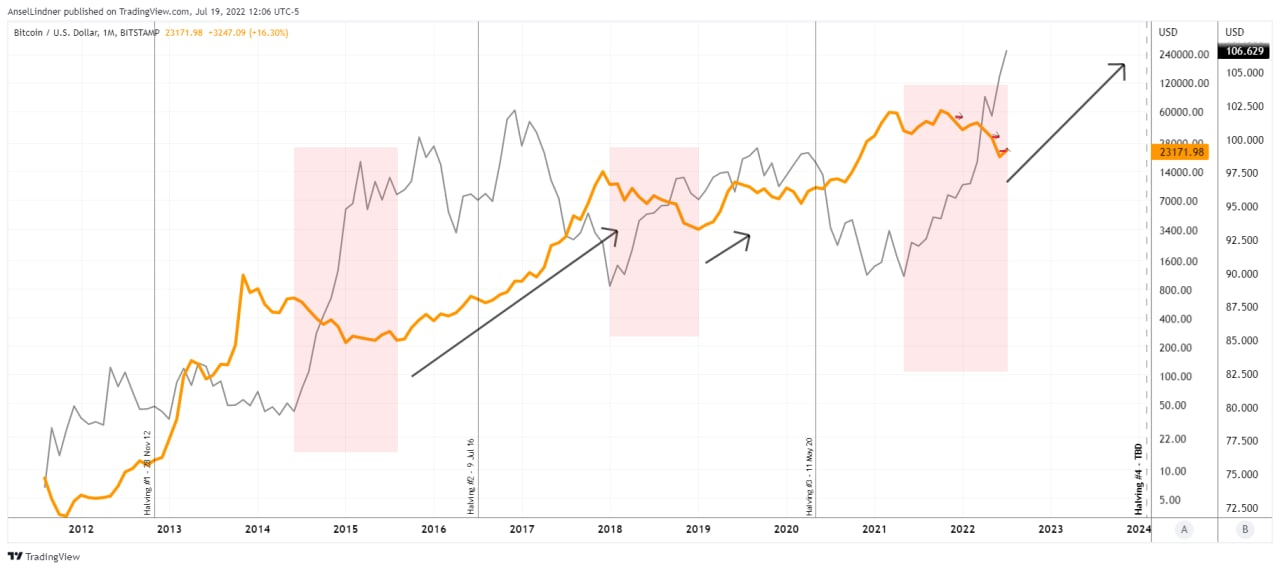
Source BitcoinAndMarkets.com
Pink is the rising dollar and falling bitcoin. Black arrows are steady dollar at a higher range and rising bitcoin. Important to note, bitcoin and the dollar have both stair stepped higher over the last 10 years, only on the slightly different schedule.
Lastly, we take a look at the Euro and discuss how and why the Euro is in the most trouble out of the major currencies. We mention fragmentation risk several times. I did a podcast episode dedicated to that topic recently.
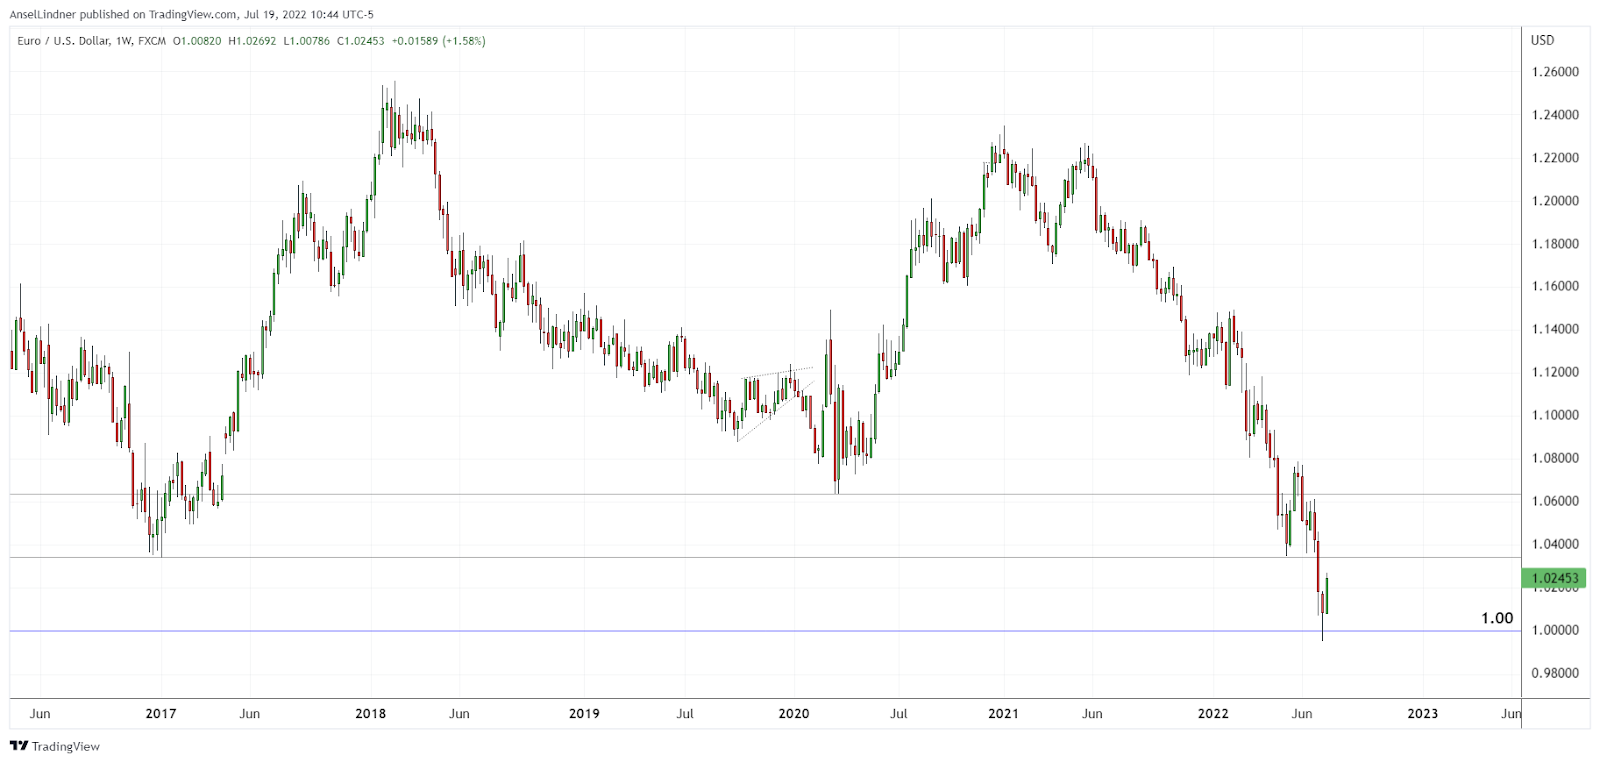
Source BitcoinAndMarkets.com


